For nation-wide data (like for Sri Lanka) you can just Google Sri Lanka HDI 2018 and it’ll take you to source material.
More conveniently, a lot of this is available on Wikipedia (with citations).
Var
3 years ago
This seems to be suffering from a heavy dose of Simpsons Statistical Paradox.
How is Odisha that far down given how many times BJD keep winning there. It has to be a Tribal and non-tribal split causing this and if so how are they tallying the non-tribal numbers if not projections of some sort.
This sort of thing also happens with the classification of India middle class whereby even though any Middle Class anywhere indeed has tiers but Indian Middle Class takes this Tier-dynamic to whole another level itself. To the point some argue there is no such thing as a Middle Class in India, as traditionally understood.
We need better statistics in general for a lot of things.
It is also an underappreciated knowledge domain and not just in technical regard. I often say the quickest way for someone who doesn’t know India & China to grasp these 2 countries is through the concept of Statistical Scale. No other method of learning about these 2 places will work faster and achieve better information processing when accounted for that shortened time frame.
“How is Odisha that far down given how many times BJD keep winning there”
Having studied there for some time, BJD is to Orissa, what Dravidian parties are to Tamil Nadu, BJP is to Gujrat.
In short the natural party of that state
Ronen
3 years ago
How is Indian Punjab so much higher than Pak Punjab? The difference between WB and Bangladesh isn’t as pronounced and appears more logical.
This graph goes to show that if Bihar + UP even reaches upper-mid tier status like Karnataka, there would be a massive boost to India’s potential. Less intra-national migration, more cost-effective supply chains in Gangetic plain, lower crime rate, more taxation, more exports, larger pool of exceptional people on right-end of distribution curve, central funds going into infra and research instead of loan waivers etc.
Prats
3 years ago
What is interesting is that the GDP per capita of Pakistani Punjab is substantially higher than that of Uttar Pradesh and Bihar.
Would be interesting to look at what components Pak Punjab scores fairs so badly.
“if Bihar + UP even reaches upper-mid tier status like Karnataka, there would be a massive boost to India’s potential.”
Female education is one of the most important leading indicators of improvement in HDI. Should really focus on that.
Primary education in general should be no.1 priority across all of BIMARU.
(Energy and Education, as I like to think are the two things holding India back and can open up virtuous feedback loops. The latter is much easier to achieve than the former.)
“What is interesting is that the GDP per capita of Pakistani Punjab is substantially higher than that of Uttar Pradesh and Bihar.
Would be interesting to look at what components Pak Punjab scores fairs so badly.”
Pak Punjab has S-Punjab AKA the UP-Bihar of that state. Northern Punjab development is also due to the same NCR – Western UP phenomena, satellite towns growth due to proximity to Capital and better developed cities.
Janamejaya
3 years ago
UP and Bihar sadly lagging behind a lot. Surprising that these areas are even below states which have active, violent insurgencies raging.
IMO, UP is kind of coming up now because of proximity to New Delhi and some good work done by Samajwadi Party and followed up by the BJP under Yogi Adityanath. The rail and road infrastructure in UP is now pretty good and will soon be one of the best in India. Lots of projects currently on at every scale. NOIDA is again growing as a good industrial and services hub after being stagnant for a long time.
But Bihar still seems to be stuck.
Any ideas about what can be done for economic growth to pick up in Eastern UP and Bihar.
I do not think with the kind of natural resources (fishing, tourism, intense cash-crop agriculture) we have in UP and Bihar we can take the Sri Lanka or Kerala route. We have to necessarily take the Gujarat route and increase business activity as well as agricultural & industrial productivity.
“Any ideas about what can be done for economic growth to pick up in Eastern UP and Bihar.”
For anything to happen there, East India needs at least one dynamic city, but after our beloved commies have totally “uplifted” Calcutta;s industry for 40 odd years, i am pretty sure nothing gonna.
Ugra
3 years ago
HDI is a typical “one size fits all” metric. Primarily built to hold up the European model in awe by Amartya Sen, it is quite misleading when used to compare a cohort of non-European states. It frankly starts failing terribly as a comparison tool when used far away from its origins.
No self-respecting middle class dwelling aspirant in India will ever opt to go and live/work in Kerala, that eternal pit of zero work-culture, where nothing happens except men and women emigrating to the “Gelf” to make ends meet.
The real superpowers in this list are Karnataka, Tamilnadu, Maharashtra and Gujarat. These are the magnets to which millions of Indians, Bangladeshis and Srilankans stream every year to study, settle, play and work.
I feel like Haryana / Delhi / Western UP is another magnet region that draws people from far and wide.
Really that whole part of North India is among the most developed parts of the country by many measures (Punjab, Himachal, Uttarakhand, Haryana, Delhi, Western UP).
“HDI is a typical “one size fits all” metric. Primarily built to hold up the European model in awe by Amartya Sen, it is quite misleading”
Commies would like a word with you….
“No self-respecting middle class dwelling aspirant in India will ever opt to go and live/work in Kerala, that eternal pit of zero work-culture, ”
Oh Hoju!
Ronen
3 years ago
“It frankly starts failing terribly as a comparison tool when used far away from its origins. No self-respecting middle-class dwelling aspirant in India will ever opt to go and live/work in Kerala…The real superpowers in this list are Karnataka, Tamilnadu, Maharashtra, and Gujarat.”
These statements show the peril of shoehorning formulae to describe things it was never meant to do. The purpose of HDI isn’t to showcase job opportunities, it’s just a geometric mean for 3 normalized indexes of life expectancy, education, and income. Iceland has a higher HDI than both the UK and the US, how many Indians would prefer working the former over the latter?
One can bring up the point that the income part of the equation in Kerala derives largely from external sources (in this case the Gulf), but that’s not the point of the data. Any economist worth his/her weight in salt would use a combination of indices and other rolling data over many years before advising the government on policy, accounting for the discrepancies in the computation based on local factors.
The category of people who get upset by index data are generally laymen who are unhappy about their own region falling behind another competing region on some areas and try to compensate by bringing in other factors that the index in question was never meant to do. As long as the information is computed by those of capable means and a non-partisan outlook it is best to take the data at face value.
Describe to me in as few words as possible what “two HDI separated states in the middle value region” would mean to an administrator and to the people of the regions. The regions are blinded, so both have no clue. Do you really think that the one with the higher HDI is better off as a rule?
I have identified more than 17 pairs, where the one with the lower HDI value is infinitely better off. And btw when something is named “human development index”, it deserves full spectrum criticism.
HDI is a Talebian IYI measure – it means nothing in the real world except to a few academics who think literacy means wisdom, longevity implies state efficiency and migration does not accumulate wealth.
Hoju
3 years ago
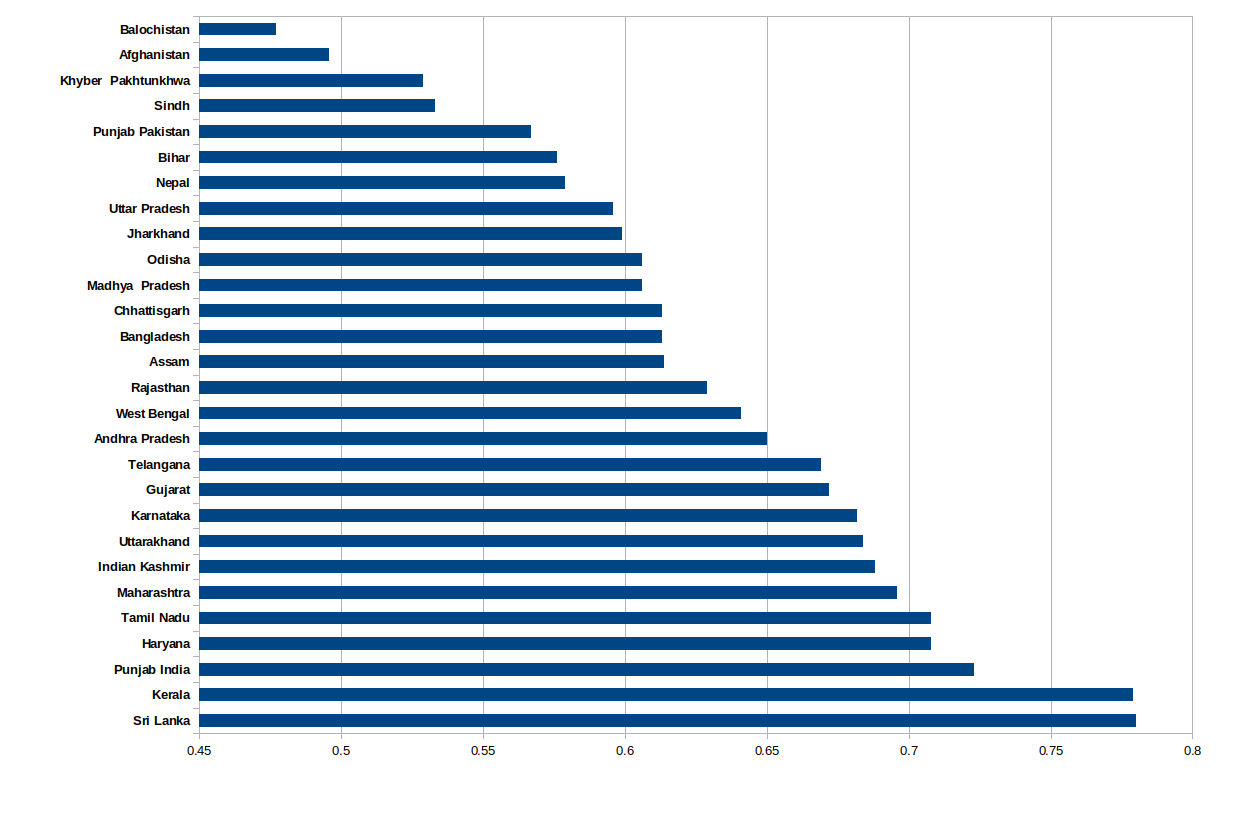
– It’s pretty crazy that Punjab province has a worse HDI than Bihar state.
– The difference between Indian Punjab and Pakistani Punjab is stark, even though both are at / near the top in their respective countries.
– Rather surprising that Nepal has a higher HDI than Pakistan, even the most developed province of Pakistan.
– Afghanistan, KP & Balochistan seem pretty similar in HDI.
– For all the deep hatred the RW has for Bengalis, West Bengal is right around average
– I didn’t include all the small NE states outside of Assam, but together they would be solidly above the Indian average in HDI.
– Would be very interesting to see disaggregated data for UP’s regions. Western UP would likely be right up there with Haryana and Punjab, or at any rate solidly above the Indian average. Eastern UP is probably the same as Bihar (if not lower) in HDI.
– Really need to see some development in the east-central region; namely Eastern UP, Jharkhand, Odisha, Chhattisgarh, Bihar & MP. I think splitting up UP & Bihar further would be helpful in this regard.
– Poor Sindh. How did it end up that way?
– Selfishly, I’m happy to see West Bengal have a solid lead over Bangladesh.
We have the Best Punjab and the Best Bengal ?
[sorry for re-posting from Open Thread, but I thought it would be more apt here]
Siddharth
3 years ago
I feel that one shouldn’t read too much into these numbers, since this is quantifying something that’s essentially qualitative, in my mind. I mean yeah no one would argue with Bihar’s HDI being lower than Kerala’s, but what’s the error bars on those numbers? I’m not familiar with HDI, but is it influenced by outliers much?
But I do think that a metric like this, if statistically sound, is probably better than GDP in measuring the quality of life as an aid to policy. I’ve also read somewhere that the much talked about ‘happiness index’ from a few years ago has been roundly debunked.
And finally, the fact that little SL, after decades of civil war has left India lagging behind is quite humbling. How does Myanmar compare? And the SE nations? I think culturally those would be better nations to compare India to rather our Western neighbors.
Hoju
3 years ago
In 2013, Raghuram Rajan and the RBI developed a multidimensional index for development to help determine how much each state should get financially and otherwise. Unlike HDI, this index factors in per-capita consumption.
Raghuram Rajan’s multidimensional index for development
*Only including major states
*Lower score = better
Looking at provincial data for Pakistan will give a very skewed picture. Lahore and northern Punjab have had the lion’s share of government spending in the province. All the hospitals, jobs and educational institutions are there. South Punjab is very underdeveloped. Similarly Karachi and interior Sindh are from different planets. Only spending in Balochistan is happening in Gwadar, the rest of the province is just used for gas extraction.
True but you could say that with many Indian states, as well. That’s why I tried to include only large, major states rather than, say, the territory of Delhi or Islamabad.
For example, Western UP is quite developed but Eastern UP is underdeveloped.
Some observations
Never thought Balochistan would be below Afghanistan. Even after CPEC and Afghan wars.
Is Pak Punjab really behind Bihar? Man! That’s mind numbing
Felt Bangaldesh HDI would not be middling but higher
My Bong bhadralok friends make fun of social indices of Gujarat. I mean…
Indian Kashmir HDI’s are that good!
Indian Punjab had been laggard state in last 2 decades with drug problems and still doing so well.
How reliable is this? Where did the ‘reader’ get the numbers?
I only checked pak and ind punjab but looks accurate based on UNHDP data.
Link also has historical data which would be interestion plot out / look at.
https://globaldatalab.org/shdi/shdi/AFG+BGD+IND+NPL+PAK+LKA/?levels=1%2B4&interpolation=0&extrapolation=0&nearest_real=0
Also have a look at this map of the world HDI by subnational regions
https://globaldatalab.org/shdi/maps/shdi/
It’s all available online. The data is for 2018.
Subnational data for 2018 is here:
https://globaldatalab.org/shdi/shdi/
For nation-wide data (like for Sri Lanka) you can just Google Sri Lanka HDI 2018 and it’ll take you to source material.
More conveniently, a lot of this is available on Wikipedia (with citations).
This seems to be suffering from a heavy dose of Simpsons Statistical Paradox.
How is Odisha that far down given how many times BJD keep winning there. It has to be a Tribal and non-tribal split causing this and if so how are they tallying the non-tribal numbers if not projections of some sort.
This sort of thing also happens with the classification of India middle class whereby even though any Middle Class anywhere indeed has tiers but Indian Middle Class takes this Tier-dynamic to whole another level itself. To the point some argue there is no such thing as a Middle Class in India, as traditionally understood.
We need better statistics in general for a lot of things.
It is also an underappreciated knowledge domain and not just in technical regard. I often say the quickest way for someone who doesn’t know India & China to grasp these 2 countries is through the concept of Statistical Scale. No other method of learning about these 2 places will work faster and achieve better information processing when accounted for that shortened time frame.
“How is Odisha that far down given how many times BJD keep winning there”
Having studied there for some time, BJD is to Orissa, what Dravidian parties are to Tamil Nadu, BJP is to Gujrat.
In short the natural party of that state
How is Indian Punjab so much higher than Pak Punjab? The difference between WB and Bangladesh isn’t as pronounced and appears more logical.
This graph goes to show that if Bihar + UP even reaches upper-mid tier status like Karnataka, there would be a massive boost to India’s potential. Less intra-national migration, more cost-effective supply chains in Gangetic plain, lower crime rate, more taxation, more exports, larger pool of exceptional people on right-end of distribution curve, central funds going into infra and research instead of loan waivers etc.
What is interesting is that the GDP per capita of Pakistani Punjab is substantially higher than that of Uttar Pradesh and Bihar.
Would be interesting to look at what components Pak Punjab scores fairs so badly.
“if Bihar + UP even reaches upper-mid tier status like Karnataka, there would be a massive boost to India’s potential.”
Female education is one of the most important leading indicators of improvement in HDI. Should really focus on that.
Primary education in general should be no.1 priority across all of BIMARU.
(Energy and Education, as I like to think are the two things holding India back and can open up virtuous feedback loops. The latter is much easier to achieve than the former.)
“What is interesting is that the GDP per capita of Pakistani Punjab is substantially higher than that of Uttar Pradesh and Bihar.
Would be interesting to look at what components Pak Punjab scores fairs so badly.”
Pak Punjab has S-Punjab AKA the UP-Bihar of that state. Northern Punjab development is also due to the same NCR – Western UP phenomena, satellite towns growth due to proximity to Capital and better developed cities.
UP and Bihar sadly lagging behind a lot. Surprising that these areas are even below states which have active, violent insurgencies raging.
IMO, UP is kind of coming up now because of proximity to New Delhi and some good work done by Samajwadi Party and followed up by the BJP under Yogi Adityanath. The rail and road infrastructure in UP is now pretty good and will soon be one of the best in India. Lots of projects currently on at every scale. NOIDA is again growing as a good industrial and services hub after being stagnant for a long time.
But Bihar still seems to be stuck.
Any ideas about what can be done for economic growth to pick up in Eastern UP and Bihar.
I do not think with the kind of natural resources (fishing, tourism, intense cash-crop agriculture) we have in UP and Bihar we can take the Sri Lanka or Kerala route. We have to necessarily take the Gujarat route and increase business activity as well as agricultural & industrial productivity.
“Any ideas about what can be done for economic growth to pick up in Eastern UP and Bihar.”
For anything to happen there, East India needs at least one dynamic city, but after our beloved commies have totally “uplifted” Calcutta;s industry for 40 odd years, i am pretty sure nothing gonna.
HDI is a typical “one size fits all” metric. Primarily built to hold up the European model in awe by Amartya Sen, it is quite misleading when used to compare a cohort of non-European states. It frankly starts failing terribly as a comparison tool when used far away from its origins.
No self-respecting middle class dwelling aspirant in India will ever opt to go and live/work in Kerala, that eternal pit of zero work-culture, where nothing happens except men and women emigrating to the “Gelf” to make ends meet.
The real superpowers in this list are Karnataka, Tamilnadu, Maharashtra and Gujarat. These are the magnets to which millions of Indians, Bangladeshis and Srilankans stream every year to study, settle, play and work.
Now build me an index for South Asia!
I feel like Haryana / Delhi / Western UP is another magnet region that draws people from far and wide.
Really that whole part of North India is among the most developed parts of the country by many measures (Punjab, Himachal, Uttarakhand, Haryana, Delhi, Western UP).
“HDI is a typical “one size fits all” metric. Primarily built to hold up the European model in awe by Amartya Sen, it is quite misleading”
Commies would like a word with you….
“No self-respecting middle class dwelling aspirant in India will ever opt to go and live/work in Kerala, that eternal pit of zero work-culture, ”
Oh Hoju!
“It frankly starts failing terribly as a comparison tool when used far away from its origins. No self-respecting middle-class dwelling aspirant in India will ever opt to go and live/work in Kerala…The real superpowers in this list are Karnataka, Tamilnadu, Maharashtra, and Gujarat.”
These statements show the peril of shoehorning formulae to describe things it was never meant to do. The purpose of HDI isn’t to showcase job opportunities, it’s just a geometric mean for 3 normalized indexes of life expectancy, education, and income. Iceland has a higher HDI than both the UK and the US, how many Indians would prefer working the former over the latter?
One can bring up the point that the income part of the equation in Kerala derives largely from external sources (in this case the Gulf), but that’s not the point of the data. Any economist worth his/her weight in salt would use a combination of indices and other rolling data over many years before advising the government on policy, accounting for the discrepancies in the computation based on local factors.
The category of people who get upset by index data are generally laymen who are unhappy about their own region falling behind another competing region on some areas and try to compensate by bringing in other factors that the index in question was never meant to do. As long as the information is computed by those of capable means and a non-partisan outlook it is best to take the data at face value.
Describe to me in as few words as possible what “two HDI separated states in the middle value region” would mean to an administrator and to the people of the regions. The regions are blinded, so both have no clue. Do you really think that the one with the higher HDI is better off as a rule?
I have identified more than 17 pairs, where the one with the lower HDI value is infinitely better off. And btw when something is named “human development index”, it deserves full spectrum criticism.
HDI is a Talebian IYI measure – it means nothing in the real world except to a few academics who think literacy means wisdom, longevity implies state efficiency and migration does not accumulate wealth.
– It’s pretty crazy that Punjab province has a worse HDI than Bihar state.
– The difference between Indian Punjab and Pakistani Punjab is stark, even though both are at / near the top in their respective countries.
– Rather surprising that Nepal has a higher HDI than Pakistan, even the most developed province of Pakistan.
– Afghanistan, KP & Balochistan seem pretty similar in HDI.
– For all the deep hatred the RW has for Bengalis, West Bengal is right around average
– I didn’t include all the small NE states outside of Assam, but together they would be solidly above the Indian average in HDI.
– Would be very interesting to see disaggregated data for UP’s regions. Western UP would likely be right up there with Haryana and Punjab, or at any rate solidly above the Indian average. Eastern UP is probably the same as Bihar (if not lower) in HDI.
– Really need to see some development in the east-central region; namely Eastern UP, Jharkhand, Odisha, Chhattisgarh, Bihar & MP. I think splitting up UP & Bihar further would be helpful in this regard.
– Poor Sindh. How did it end up that way?
– Selfishly, I’m happy to see West Bengal have a solid lead over Bangladesh.
We have the Best Punjab and the Best Bengal ?
[sorry for re-posting from Open Thread, but I thought it would be more apt here]
I feel that one shouldn’t read too much into these numbers, since this is quantifying something that’s essentially qualitative, in my mind. I mean yeah no one would argue with Bihar’s HDI being lower than Kerala’s, but what’s the error bars on those numbers? I’m not familiar with HDI, but is it influenced by outliers much?
But I do think that a metric like this, if statistically sound, is probably better than GDP in measuring the quality of life as an aid to policy. I’ve also read somewhere that the much talked about ‘happiness index’ from a few years ago has been roundly debunked.
And finally, the fact that little SL, after decades of civil war has left India lagging behind is quite humbling. How does Myanmar compare? And the SE nations? I think culturally those would be better nations to compare India to rather our Western neighbors.
In 2013, Raghuram Rajan and the RBI developed a multidimensional index for development to help determine how much each state should get financially and otherwise. Unlike HDI, this index factors in per-capita consumption.
Raghuram Rajan’s multidimensional index for development
*Only including major states
*Lower score = better
1. Kerala – 0.095
2. Tamil Nadu – 0.341
3. Punjab – 0.345
4. Maharashtra – 0.352
5. Uttarakhand – 0.383
6. Haryana – 0.395
7. Karnataka – 0.453
8. Gujarat – 0.491
9. Indian Kashmir – 0.504
10. Andhra Pradesh (incl Telangana) – 0.521
11. Bengal – 0.551
12. Rajasthan – 0.626
13. Uttar Pradesh – 0.638
14. Assam – 0.707
15. Jharkhand – 0.746
16. Chhattisgarh – 0.752
17. Madhya Pradesh – 0.759
18. Bihar – 0.765
19. Odisha – 0.798
Looking at provincial data for Pakistan will give a very skewed picture. Lahore and northern Punjab have had the lion’s share of government spending in the province. All the hospitals, jobs and educational institutions are there. South Punjab is very underdeveloped. Similarly Karachi and interior Sindh are from different planets. Only spending in Balochistan is happening in Gwadar, the rest of the province is just used for gas extraction.
https://tribune.com.pk/story/1126363/people-living-northern-punjab-urban-sindh-prosperous-rest-country-report?amp=1
True but you could say that with many Indian states, as well. That’s why I tried to include only large, major states rather than, say, the territory of Delhi or Islamabad.
For example, Western UP is quite developed but Eastern UP is underdeveloped.