Genetic odds & ends

At my other weblog I report on evidence that a sample from Cambodia dated to 100 to 300 AD seems to have considerable Indian ancestry. This is not a result in isolation. Lots of evidence points to non-trivial Indian gene flow. The devil is now in the details of when/who.

Second, there is lots of talk about “person X looks like population Y, so perhaps they have ancestry from population Y.” This is almost certainly wrong in most cases.

Looking at Indian populations there tends to be far more variation in physical appearance within a population than the variation of total ancestry. In other words, some Tamil Brahmins look like South Indian Tribal people and other Tamil Brahmins look like West Asians. But in terms of total ancestral components, there’s no difference.

The theoretical explanation for what’s going on is that the genetic loci which control “physical appearance” are much smaller in number than the whole genome (on the order of dozens of loci). As such, the sample variance is rather large (the N denominator is small).

South Asian populations differ across each other, but there is usually a quite large within-population variation on genetic variants implicated in physical characteristics. This means that there are a large range and quite a bit of variation.

Though a lot of the discussion involves Muslims, I have heard from multiple non-Muslim people of Northwest Indian stock (e.g., Pandits) that they must have “Persian ancestry” because they look so Persian. The genetics refutes this rather strongly. Rather, modern Persians and many Northwest Indians share deep ancestry which diverged after the Last Glacial Maximum 20,000 years ago.

American Caste (b)

America has a national crisis in math capacity, competence and merit. American students sharply underperform students in many countries all over the world. Including Vietnam, which is a poorer country than India per capita. We will heavily refer to the 2018 OECD PISA report in below paragraphs, but the below chart graphic is from the 2015 OECD PISA scores report because math scores are reported for more countries in the 2015 report. Perhaps the 2018 report will be revised to add more countries in the future:

In my view  a level 5 PISA score is the minimum requirement for a person to be considered a high school graduate who is literate in math, able to function in the modern global economy, or be qualified to attend college. The PISA report defines a level 5 PISA score or better as a fifteen year old that “can model complex situations mathematically, and can select, compare and evaluate appropriate problem-solving strategies for dealing with them.” How does America perform in the 2018 PISA report?:

  • United States: 8% of students scored at Level 5 or higher in mathematics
  • OECD average: 11%
  • Six Asian countries and economies had the largest shares of students who did so:
    • Beijing, Shanghai, Jiangsu and Zhejiang (China): 44%
    • Singapore: 37%
    • Hong Kong (China): 29%
    • Macao (China): 28%
    • Chinese Taipei: 23%
    • Korea: 21%

Note that these six countries were among the poorest countries in the world in the 1950s, far poorer than poor Americans or poor Europeans or poor Chileans can even imagine. In 1979 China was unbelievably poor. Much of the population of China–perhaps as many as 100 million–had starved to death because of extreme poverty in the 1970s. Poor children around the world are outperforming American children in mathematics despite extremely low education spending per student and very low socio-economic level of their legal guardians, where socio-economic level is defined as:

  • income
  • wealth
  • formal education of parents

Do any American high school student subgroups perform well in Mathematics? Yes, “people of color” or “minority” Americans perform well in Mathematics. America’s “people of color” or “minority” students are orders of magnitude more likely to get an 800 on the mathematics SAT than European Americans. If we assume this is an extreme tail end distribution issue related to European Americans having a lower standard deviation and non standard distribution in mathematics performance relative to “people of color” or “minority” Americans, we can explore the breakdown of Americans who score between 750 and 800 on the Mathematics SAT. Here European Americans perform far better relative to “people of color” or “minority” Americans.  In 2015 16,000 European Americans scored 750 or higher. 33,000 “people of color” and “minority” Americans scored 750 or higher. We further know that 51% of SAT test takers were European Americans and 49% were “people of color” or “minority” Americans.  “People of color” or “minority” Americans are [33,000/16,000]*[51%/49%] or 2.15 times as likely to score 750 or higher on the mathematics SAT compared to European Americans.  If we examine the 107,900 test takers who got SAT math scores of 700 or higher; 59,900 are “people of color” or “minority” Americans, versus 48,000 European Americans. “People of color” or “minority” Americans are [59,900/48,000]*[51%/49%] or 1.30 times as likely to score 700 or higher on the mathematics SAT compared to European Americans. For data junkie geeks like me there is a lot more data on SAT math score distributions here and here. The Greta Anderson article’s comment section in particular has some very intelligent commentators who have studied the American SAT score distribution. This is likely to be the subject of many future blog posts and Brown Pundits Podcasts.

What about this is worrying?:

  1. European Americans in particular are sharply under-performing both very poor children around the world and “people of color” and “minority” Americans in mathematics.
  2. American mathematics SAT scores have fallen between 1972 and 2016. 1972 is the earliest year for which I could find comparable SAT mathematics scores. In 2017, 2018 and 2019 the SAT mathematics exam was completely restructured to make scores no longer comparable to SAT mathematics scores between 1972 and 2016.
  3. 90% or more of current jobs and businesses are likely to be replaced by artificial intelligence (AI), brain electro-therapy (meditation . . . practiced by civilizations around the world for over 5,000 years), brain sound therapy (naad or mantra yoga and their equivalents in Native American, Egyptian, Sumerian, Taoist and other civilizations around the world for over 5,000 years), bio-engineering tissue, genetic editing, and fused AI-brain interface synthesis intelligence. Almost all of these future disciplines are complementary to mathematics.

Future articles and podcasts are planned all six of these future disciplines. If you are curious about fused AI-brain interface synthesis intelligence, please watch my main man Elon Musk:

Some say that the tension and relationship challenges between America’s four big castes–European Americans, European “Latino” Americans, Black Americans and Asian American–are driving low math scores for European Americans “AND” other Americans. One example is where thought leader Mark J Perry explores the possibility that tension between the European American caste and the Asian American caste are lowering American  mathematics performance. Excerpts of his article are reproduced below:

Continue reading American Caste (b)

Some admixture coefficients for South Asian Genotype Project members

I decided to run qpAdmin on a large number of the South Asian Genotype Project members. The codes should be self-evident for the individuals. The Indus Periphery samples are from the Reich dataset. The steppe is all Sintashta samples from the recent publication (I removed outliers). The Andamanese hunter-gatherers are from the Andamans.

Some of the populations are not good fits on the India cline. Adding Dai as East Asian improves the fit for the Bengali Kayastha. But it messes it up for most of the others.

Please note that these are individuals. There is going to be variance within populations.

Continue reading Some admixture coefficients for South Asian Genotype Project members

A model runs through it

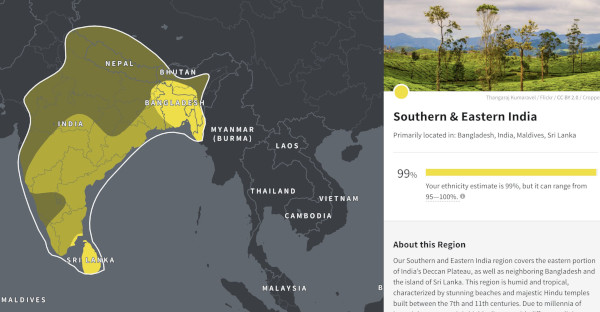
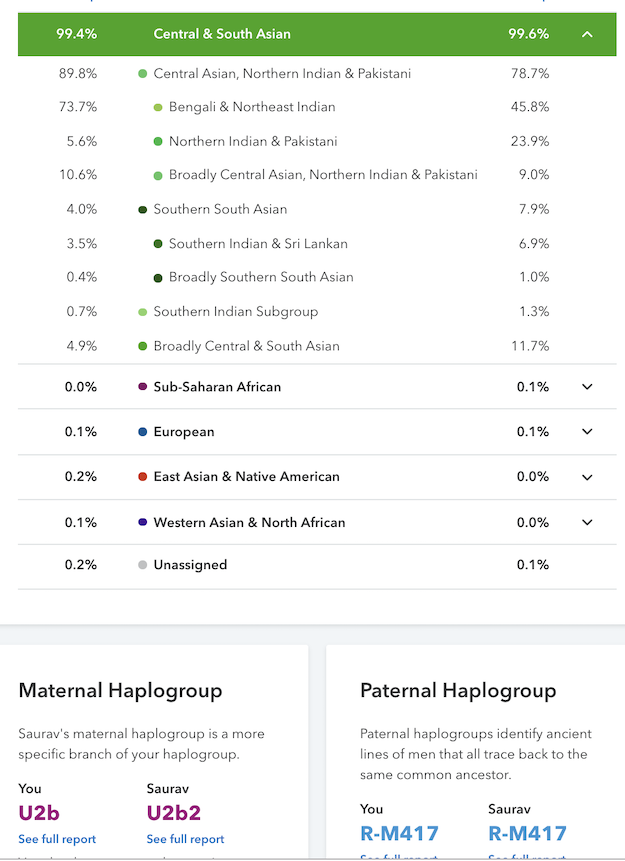
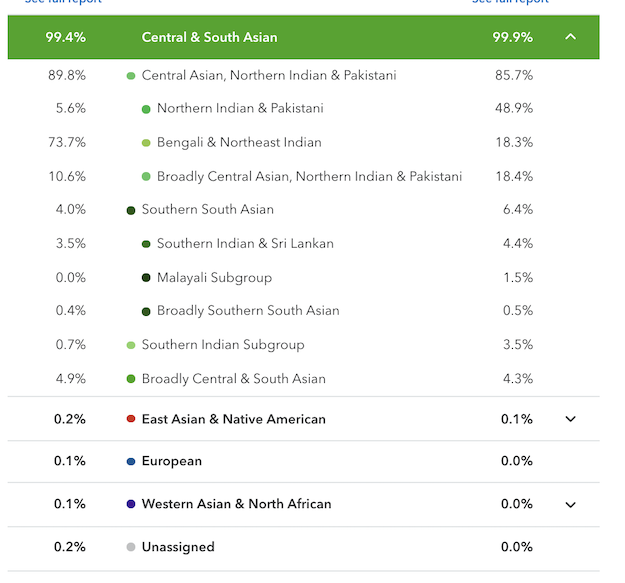
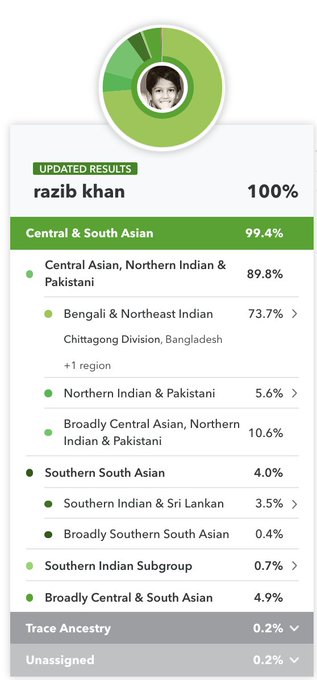
Recently I made a comment that I appreciate what 23andMe and Ancestry have done with their South Asian ancestry updates. My own results came into sharper focus. The algorithms did what they were supposed to do.
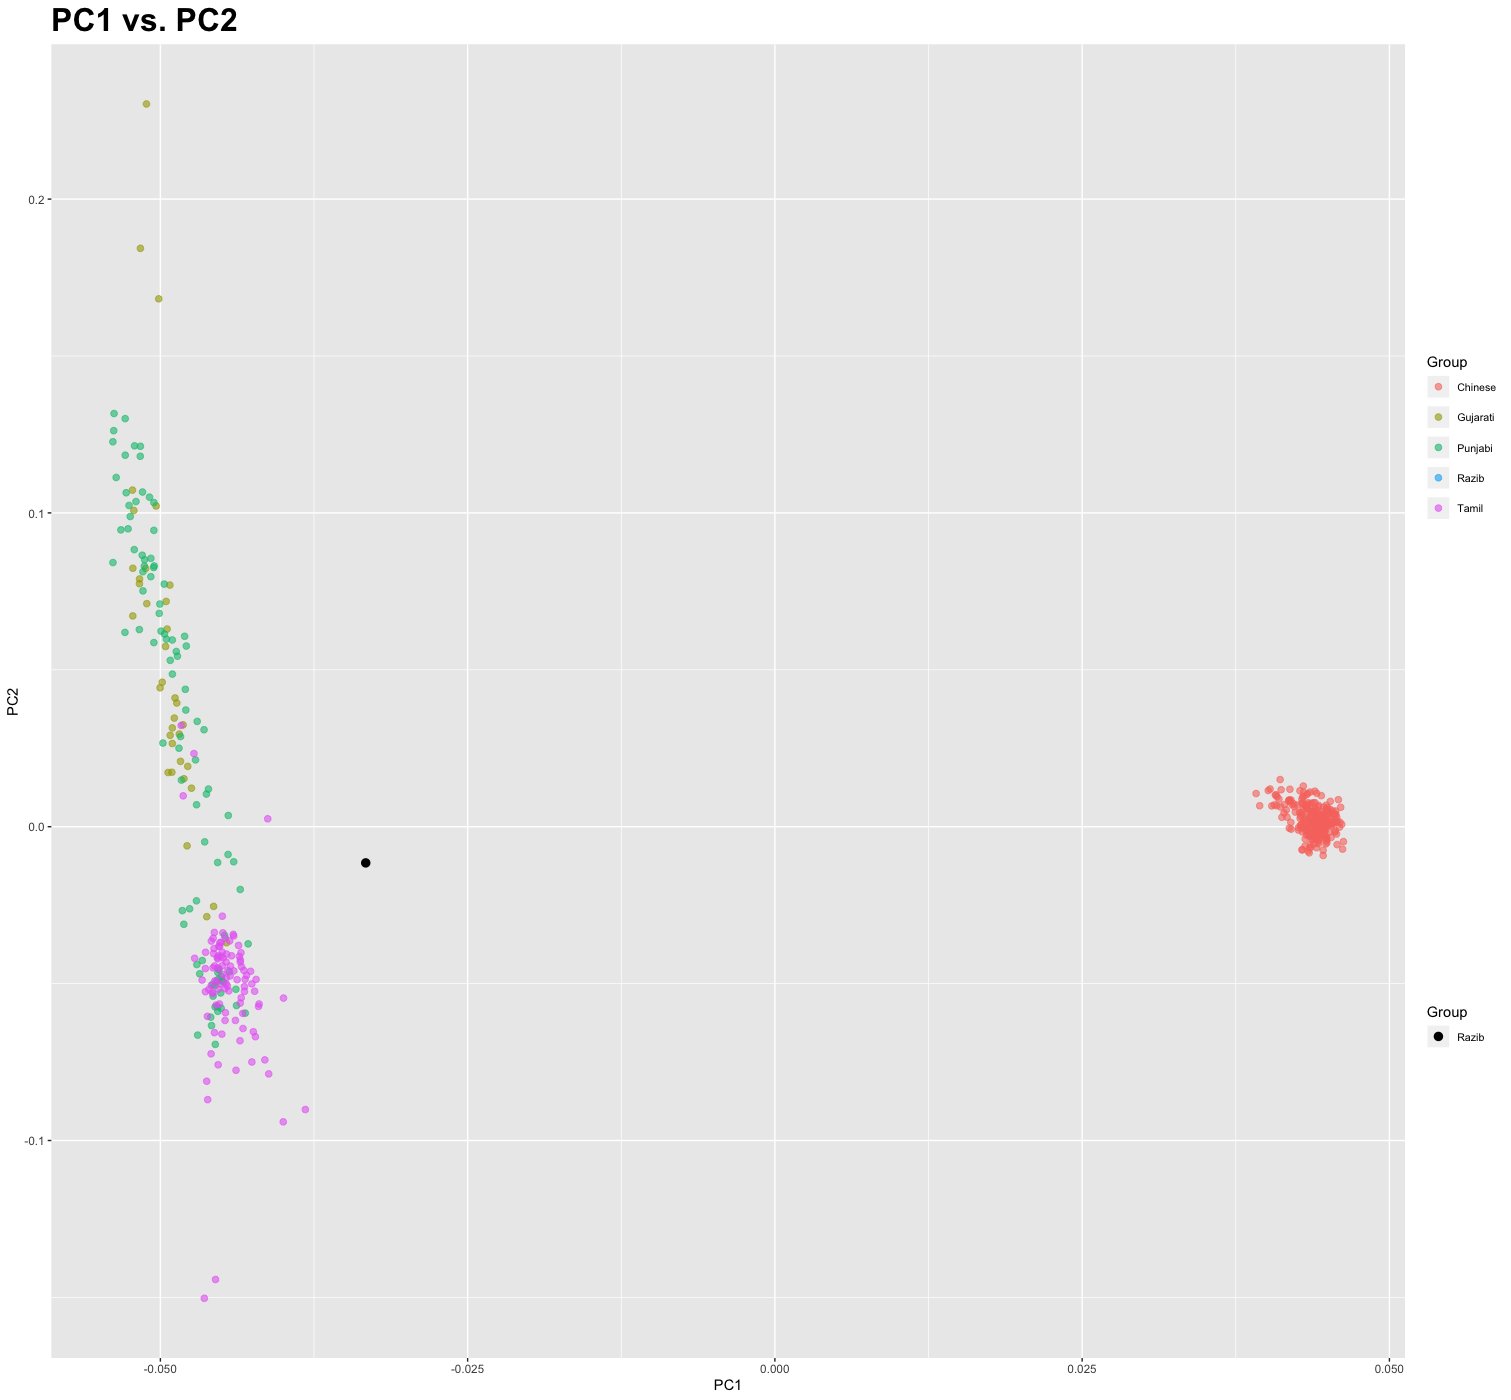
Both of the companies found that I’m probably Bengali. 23andMe, with its massive database, and SVM framework, even narrowed down where in Bangladesh my family is from.

Both my parents are from Comilla. More specifically, my mother’s family is from Homna (though her maternal grandfather was from Noakhali by origin). When I was small I was sent to stay with my mother’s relatives in Sreemudi village, which I can now find on Google maps! My father’s family is from just outside of Chandpur. Basically, my family hails from the lower reaches of the Meghna river. And more precisely, the eastern shore of the Meghna.

And yet this analysis is missing something. The term and category “Bengali” has implicit within it other phenomena. I generated a PCA which illustrates this well:

You can see I’m pretty clearly shifted toward East Asians. That’s because that’s common in Bengalis. That seems like it’s interesting information people would like to know. But simply creating a “Bengali” category masks all that.

Speaking of genetics, I finally got around to playing around with qpAdmin. People keeping asking me Bengali percentages of the various ancestral components in the recent Reich lab India paper. Well, I ran the same model (mostly, not exactly sure of all the samples….), and got some results.

  IndusValley Steppe AHG/AASI EastAsian Birhror (Munda)
Bengali 0.448 0.126 0.301 0.125  
Punjabi – Lahore 0.58 0.2 0.192 0.03  
Tamil – Sri Lanka 0.57 0.07 0.38 -0.025  
Gujarati 0.59 0.18 0.21 0.03  
Telugu 0.595 0.085 0.33 0  
Birhor 0.27 0 0.49 0.24  
Bengali -0.163 0.142 -0.86 -0.364 2.25
Bengali 0.264 0.136 -0.075   0.675

The “Bengali” sample is from the 1000 Genomes. You can see that 12.5% of the ancestry is “East Asian”. These are Dai. The AHG are modeled as being related to the Andamanese as per the Reich lab paper, and Indus Valley are the pooled IndPe samples. Steppe are Sintashta.

I ran the other 1000 Genomes samples with the same model. The -0.025% for Tamils for East Asian is that this model is really not necessary for them. I kept the East Asian in there to compare apples to apples with the Bengalis.

I also looked at Munda population, the Birhor. The results align perfectly with what we know. The Munda have no steppe ancestry. But, they have a lot of East Asian ancestry. One hypothesis for Bengalis is that they have Munda ancestry. But when I add them to the model you can see the results are crazy. If I swap out the East Asians with the Munda the results make some sense, but standard errors are way higher than in the model with the Dai/East Asians.

Basically, Bengali (Dhaka) samples have East Asian ancestry that’s more like populations to their east, and not like the Munda to their south and west.

O2a and Munda


Counting the paternal founders of Austroasiatic speakers associated with the language dispersal in South Asia:

The phylogenetic analysis of Y chromosomal haplogroup O2a-M95 was crucial to determine the nested structure of South Asian branches within the larger tree, predominantly present in East and Southeast Asia. However, it had previously been unclear how many founders brought the haplogroup O2a-M95 to South Asia. On the basis of the updated Y chromosomal tree for haplogroup O2a-M95, we analysed 1,437 male samples from South Asia for various downstream markers, carefully selected from the extant phylogenetic tree. With this increased resolution, we were able to identify at least three founders downstream to haplogroup O2a-M95 who are likely to have been associated with the dispersal of Austroasiatic languages to South Asia. The fourth founder was exclusively present amongst Tibeto-Burman speakers of Manipur and Bangladesh. In sum, our new results suggest the arrival of Austroasiatic languages in South Asia during last five thousand years.

From the discussion:

The diverse founders as well as the large number of unclassified samples (41% for Mundari, 38% for Khasi and 1% for Tibeto-Burmans) suggest that the migration of Austroasiatic speakers to South Asia was not associated with the migration of a single clan or a drifted population. Neither does the contrasting distribution of various founders discovered in this study amongst both Mundari and Tibeto-Burman populations support the assimilation of the former to the latter.

West Bengal Kayasthas are heterogeneous paternally and conventional Bengalis overall


A few years ago there was a short paper that analyzed genotypes from some Kulin Kayasthas from West Bengal. The plot above illustrates what you really need to know. The Kayasthas are positioned on the PCA right between East Bengalis and people from the main India cline, with a slight shift toward more ANI.

I’ve looked at a few West Bengal Kayasthas myself, and that’s what I always see. When I look at individuals from Bangladesh, the ones with the most East Asian ancestry are invariably from the furthest east. So it looks like going from eastern Bengal to western Bengal there is progressively less East Asian ancestry. And, unlike Bengali Brahmins, Bengali Kayasthas do not seem to be that different from generic Bengalis as such. In contrast, Bengali Brahmins tend to have a strong shift toward Uttar Pradesh populations and look very similar to Uttar Pradesh Brahmins with a minority non-Brahmin Bengali admixture.

Finally, take a look at the Y and mtDNA. Though R1a is overrepresented, one of the Kayasthas has both male and female East Asian uniparental lineages.

South Asian human geography as a post-Aryan synthesis


One of the things that is evident in the most recent work on Indian genetics is that some groups, often Brahmin, are enriched for “steppe” ancestry when looking at overall contributions of proximal ancestral components. But, there are other groups that are enriched for “Indus Periphery” ancestry. The plot above takes Indus Periphery on the x-axis, and steppe on the y-axis. You can see that Brahmins are above the main trend, but groups like “Panta Kapu” are below (click the image).

These trends can be hard to spot because of the complexity of the Indian genomic landscape, where geography is not entirely predictive. What explains them?

I outlined my general model in a blog post, The Aryan Integration Theory (AIT). In short, unlike Northern Europe, and like Southern Europe, pre-Indo-European cultural matrices have maintained some robustness in the face of agro-pastoralist intrusion. The persistence of linguistic isolates in the far northwest in the form of Burusho is indicative of this. But also the persistence of the Dravidian language family, which has pre-Aryan roots. The enrichment of “Indus Periphery” ancestry in groups in the west and south, in particular, as well as a Dravidian substrate in toponyms in Gujarat and Maharashtra, and the relative lack of such features in the Gangetic plain, point to the reality that Dravidian speaking peoples are not primal, but their current range is partially reflective of the human geography in the wake of the Indo-Aryan shock on the decaying IVC.

23andMe says Bangladeshis are more Bengali than West Bengalis!

As some of you may know 23andMe updated its South Asian ancestry panel. On the whole, I’ll give it a thumbs up, but, you need to be aware of the way they’re framing things. For example, pretty much every Bangladeshi has more “Bengali” ancestry than people from West Bengal.

The profile above on the left is mine. On the right is a friend whose background is West Bengali, of the Kayastha caste. Basically, 23andMe seems to be taking the East Asian enriched ancestry of Bangladeshi Bengalis as more diagnostic of being Bengali.

Now, compare me to a Bengali Brahmin (on the right):

So in all likelihood, Tagore’s ancestry composition would result in not so much “Bengali”….

“OBC” in West Bengal a social construct?

Recent population history inferred from more than 5,000 high-coverage South Asian genomes:

Next, we developed a novel method for estimating the genome-wide average divergence time between a single individual and a focal group. This method focuses on extremely rare variants, which should be the most informative about very recent demographic events, and is robust to demographic events affecting the particular individual studied. We focused this work on samples from Birbhum district, West Bengal due to the presence of additional metadata on caste and religion. We used 704 general-caste individuals from Birbhum as the focal group, and estimated divergence times for all other individuals. Mean divergence times ranged from ~2,600 years for the Santal, an Austro-Asiatic language speaking tribal group, to 850 years for “scheduled castes” (i.e., Dalits), 625 years for Bangladeshis and 225 years for “Other Backward Castes” (OBC) individuals. The recent divergence times for OBC individuals confirms that this category is more of a political construct than a long-lived social grouping, while the other divergence times suggest a substantial amount of gene flow between groups. Finally, we extended our approach to thousands of other genomes from around the world. We show how patterns of rare variation can be used to detect asymmetrical migration, and document evidence for more migration from East Asia into Bengal than the converse.

The maritime origins of the Munda

A reader pointing me to a paper whose hypothesis is novel to me. But, I have to say that reading the paper, I am now convinced this is highly likely. The paper is The Munda Maritime Hypothesis:

On the basis of historical linguistic and language geographic evidence, the authors advance the novel hypothesis that the Munda languages originated on the east coast of India after their Austroasiatic precursor arrived via a maritime route from Southeast Asia, 3,500 to 4,000 years ago. Based on the linguistic evidence, we argue that pre-Proto-Munda arose in Mainland Southeast Asia after the spread of rice agriculture in the late Neolithic period, sometime after 4,500 years ago. A small Austroasiatic population then brought pre-Proto-Munda by means of a maritime route across the Bay of Bengal to the Mahanadi Delta region – an important hub location for maritime trade in historic and pre-historic times. The interaction with a local South Asian population gave rise to proto-Munda and the Munda branch of Austroasiatic. The Maritime Hypothesis accounts for the linguistic evidence better than other scenarios such as an Indian origin of Austroasiatic or a migration from Southeast Asia through the Brahmaputra basin. The available evidence from archaeology and genetics further supports the hypothesis of a small founder population of Austroasiatic speakers arriving in Odisha from Southeast Asia before the Aryan conquest in the Iron-Age.

For me, the Brahmaputra migration always implied that Bangladeshis should have lots of Munda ancestry. And yet that is not clear from genetics (though a few individuals are shifted in that direction). In contrast, they do have a strong affinity to the Khasi. This paper proposes that the Khasi are quite distinct from the Munda.

Rather, the Munda are placed further south, and their arrival in South Asia was through maritime means. One of the possibilities suggested is a relation to the Aslian subgroup of Austro-Asiatic languages in central Malaysia. This could actually help explain the enrichment for AASI in the Munda: the indigenous Negritos of Malaysia are similar to the people of the Andaman islands!

Remember, the arrival of Austro-Asiatic farmers in northern Vietnam dates to ~4,000 years ago. The Munda could be relative latecomers to South Asia…

Brown Pundits