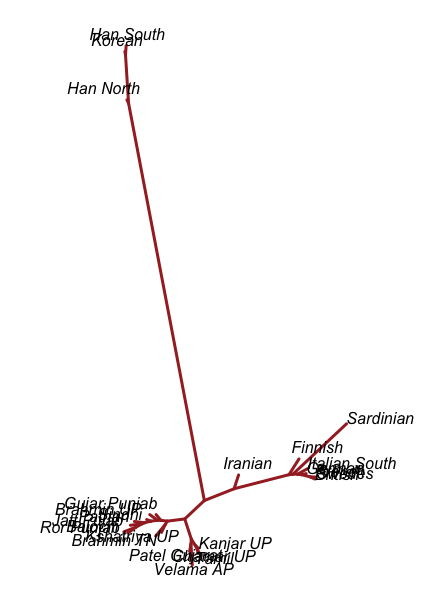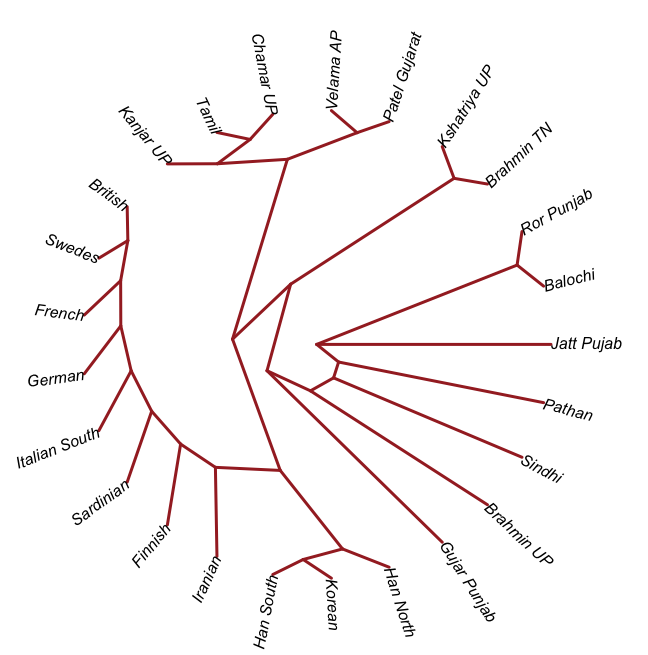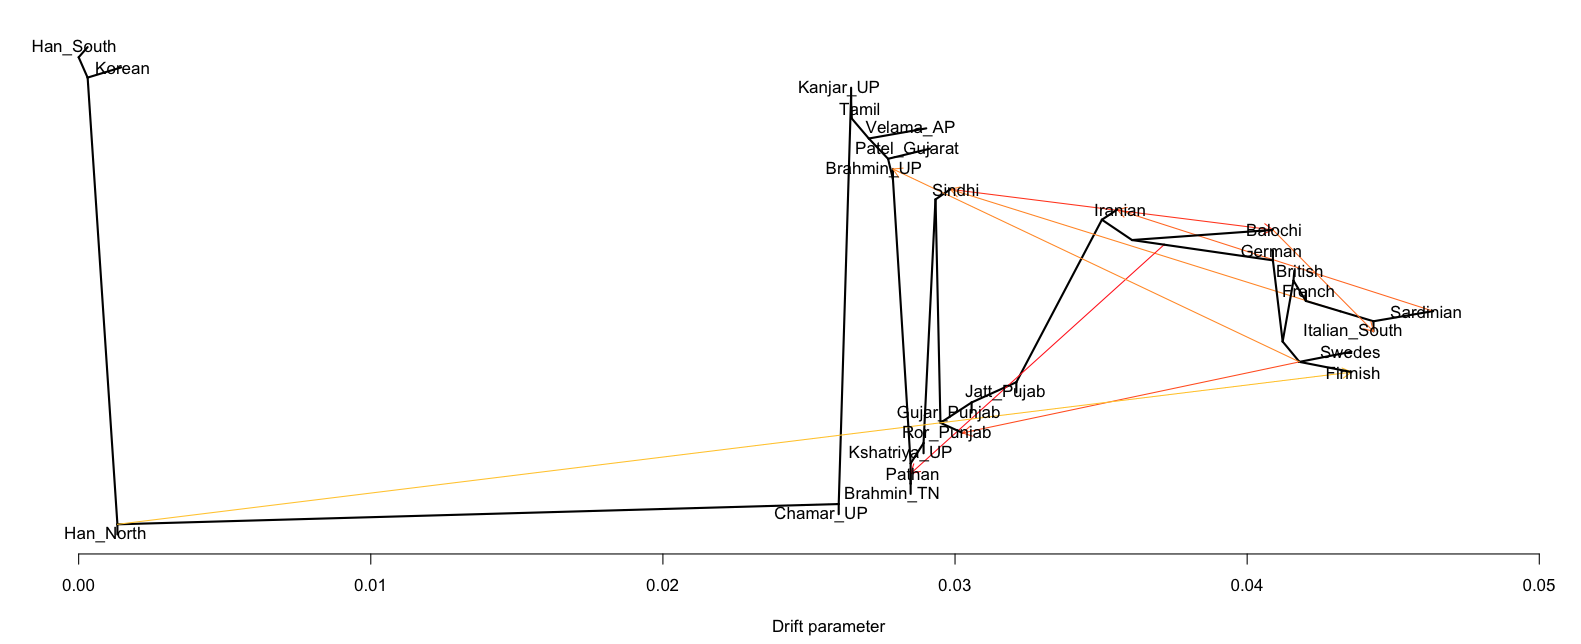
There was some discussion online about variation among South Asians. I decided to compute a few pairwise Fst statistics (measures between population variation) with some South Asian, European and East Asian populations (along with Iranians). I plot them below in two graphs. Also I ran Treemix.
I don’t have any major conclusion, just draw your own conclusion.
Here is a Google sheets with Fst values in a matrix.