The following post is contributed by @saiarav from X or Yajnavalkya from Medium
Why Yogi’s economic record is so crucial for India?
Yogi’s economic governance record as the CM of UP over the last 6+ years is perhaps amongst the most critical economic debates that India should be having today. Not just because Yogi is one of the frontrunners to succeed Modi as the PM — he is clearly a favorite with the BJP base in social media, and possibly among grassroot workers across the country as well; but equally, if not more importantly, because he is ruling India’s largest state which accounts for more than one-sixth of its population – a desperately poor, backward state which has been misgoverned for decades — and India’s growth trajectory is crucially dependent on how well he can deliver on UP’s economy over the medium term. Not to mention, UP is also Modi’s karmabhoomi and has been the bedrock of his stunning back-to-back victories in the national elections, predicated on the promise of acche din (“good days”).
Shockingly but not entirely surprisingly, there has been very little substantive debate on a topic as important as this. So here is my modest attempt at contributing to the discourse. To set the contours of the analysis:
- A) The discussion will be limited to analysis of hard economic data — for example, I am not trying to capture the qualitative impact of improved law & order, lower corruption and so on. It does not mean they are not important, just that its beyond the scope of this analysis
- B) This is not meant to be a comprehensive analysis of the economy. I will focus on a few key economic and fiscal indicators to draw broad conclusions
- C) The analysis is decidedly backward looking. I am evaluating the performance of the last 6+ years. It is quite possible that due to factors not covered in A) and B), UP will see shift in growth trajectory going forward. I welcome others to contribute to that discussion based on a data-driven analysis, and not just a qualitative narrative
A disclosure regarding my ideological co-ordinates. Those who follow me on X (@/saiarav) will know that I am broadly sympathetic to BJP both on cultural/political issues as well as economic ones. But I like to think of myself as someone who forms a view on each topic based on the merits of the case. I do not think of myself as a Modi or Yogi fan.
Key takeaways – economic growth has been underwhelming, fiscal policy likely misfired
- The economic growth record under Yogi has been underwhelming…so far. The state has beat the national growth average by a modest 20 bps (100 bps = 1 percent) annually during his first 6 years. Specifically growth was quite weak in the initial three years . Considering UP’s per capita income is less than half the national average, any growth outperformance of less than 100 bps per year should be considered below average
- Looking at GDP internals, the performance in agriculture sector has been disappointing. Industry sector, after initial years of weakness, appears to be showing some promise in recent years though data for the latest year (2022-23) appears dodgy
- A major driver for the weak economic performance in the initial years was an inexplicably tight fiscal policy stance amidst economic pain from GST and demonitisation. The fiscal contracted by 5% (as % of GDP) in the first three years of Yogi rule, which is a meaningful fiscal shock. Unless there are genuine non-economic reasons for this stance, it should be considered a major policy misstep
- Contrary to popular narrative among Yogi supporters about Yogi being focused on infrastructure spend, capex during Yogi’s first term was a significant step-down versus AKhilesh’s period.
Conclusion – give Yogi more time, but desist from premature triumphalism
Yogi’s less than stellar record on the economic front so far is, by no stretch, a reason to write him off.
Yogi’s administrative record overall has arguably been good, especially his tough approach to law & order, in a traditionally lawless state. Welfare programs appear to have been executed well with relatively low leakage, seen as a key reason for his re-election last year. But these are relatively low-hanging fruits. Turning around a poor economy like UP and putting it on the path to growth is a much more arduous task, in fact it is a multi-decade project. I posit that desisting from premature triumphalism and focus instead on a more critical examination of Yogi’s administration would serve the cause well.
The analysis of Yogi’s economic performance follows. I have divided it into five sections.
Section I: Yogi’s UP — growth has been underwhelming
In this section, I analyze UP’s GDP growth performance under Yogi rule for the period FY 17–18 to FY 22–23. One would think that is a fairly straightforward exercise, but in the idiosyncratic world of Indian government statistics, turns out it is not (more on that in a bit).
UP’s economic landscape – a poor, agrarian economy outside the NCR region
Let us first understand what the economic landscape of UP was when Yogi took over as CM in March 2017. UP was the third largest economy in India in FY 16–17 (year ending Mar 31), the year Yogi took over with GSDP (current prices) of Rs.12.9T (~$200bn) or about 8% of India’s GDP. But UP also accounted for little over one-sixth of India’s population which meant that in per capita (PC) terms, it was the second poorest state in the country with per capita NSDP of Rs.53K (~$800), which was just 45% of the national average. Bihar at Rs. 34K (<$600) was way poorer but for UP having a share of the economic pie from the thriving NCR, the gap would have been narrower. Coincidentally, the much richer Tamil Nadu (3x UP’s PC NSDP) overtook UP as the second largest economy during the year Yogi took oath as CM — as good as sign as any about the scale of the challenge facing Yogi.
As one would expect, agriculture contributes to a higher share of GDP relative to the national economy. During FY 16–17, agriculture and allied activity contributed 22% of state’s GVA (constant 2011–12 prices, ~25% at current) compared to national average of ~15%. Industry (manufacturing + mining + power and water utilities) contributed 21% while services accounted for the remaining 57%.
A caveat – dodgy statistics make the analysis fraught
Ok, so now to the absurdity in the statistics that I was referring to earlier — between FY 14–15 and FY 16–17, the officially reported manufacturing GVA (at constant prices) nearly doubled! There is absolutely no clarity on what that actually means except for an extremely vague statement by the UP Principal Secretary that it was the “result of old adjustments” in data by the central government. We are talking of a $200bn economy here and more than six years after the GDP numbers have been reported, we do not know what was the real size of a key sector in FY 16–17. This confusion in figures for the baseline year makes any analysis problematic but thankfully, given manufacturing is only about 15% of GVA, we can make do with some downward adjustments to get to a more realistic GVA figure for the sector for FY 16–17 — In effect, I am lowering FY 16–17 GDP by 2.0%. A lower GSDP for FY 16–17 versus the officially reported figures will result in growth numbers for the Yogi period higher than official numbers. While that would bump up the growth figures for FY 17–18, over a 6-year period, the impact on annual growth figures is not majorly distorting.
As I will discuss later, the agriculture growth figures for 2021-22 and industry growth figures for 2022-23 also are quite whacky, which makes the analysis fraught.
Economic growth under Yogi has been underwhelming
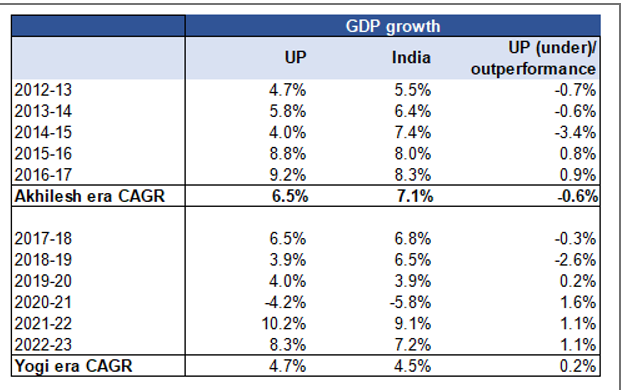
With the above caveat in place, now we move on to looking at the annual GDP growth trends for UP. But growth figures makes sense only when it is put into a broader economic context. So we look at relative performance versus the national average. The big takeaway: UP GDP has grown at a CAGR of 4.7%, 20 bps above India during the Yogi era. If one uses the official GDP figures, it would be 4.3% CAGR and a 20 bps underperformance. Either ways, prima facie, this is not a terrific performance for a state with a per capita NSDP less than half the national average — one would think anything less than a 100 bps annual outperformance should be deemed below average for a state like UP. But a more decisive call can be taken only after looking at the internals of the growth numbers and the fiscal policy adopted by this govt. One cannot comment with any level of confidence about FY 17–18 growth figures but what is clear is that growth was weak (relative to the national average) during the first three years and then started outperforming, albeit modestly.
Based on official figures, Akhilesh era growth would have been 6.9% while my adjusted numbers show growth of 6.5%. So it is reasonable to conclude Yogi has done broadly in-line to modestly better vs Akhilesh. But I have to caution that any comparison is fraught given the FY 16–17 numbers are messed up.
Section II: Taking a detour, agri growth numbers make no sense!
I had initially planned to analyze the internals of the GDP growth figures during the Yogi era in Section II. But after looking more closely at the agriculture sector numbers, I realised I needed to preface that with caveats about the agriculture sector growth numbers for FY 21–22 which are abnormally high, to put it mildly. A reminder that manufacturing sector figures were out of whack for FY 16–17, as I had discussed earlier. As an aside, I had pointed out a year back that Karnataka state government budget had the wrong set of GDP figures for two consecutive years! Overall, does not serve to instil a lot of faith in our statistical system or that our political rulers and permanent rulers (i.e. the bureaucracy) really have a good grasp of these numbers; not a comforting thought when they are running a diversified, sophisticated, $4T economy, eh?
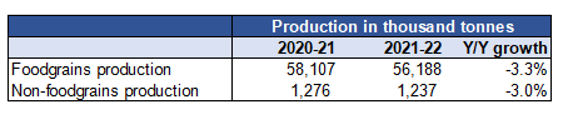
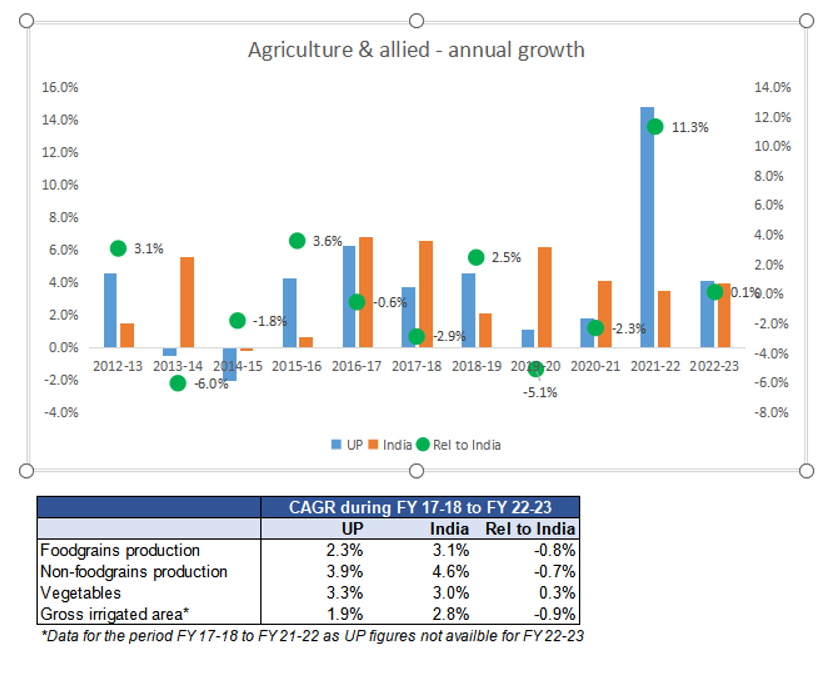
Anyways, here is the issue with the agriculture sector figures. During FY 21–22, the official numbers show that Agriculture & allied activities grew by an eye-popping 15% y/y while agricultural crops (which accounts for two-thirds of the sector) grew by an even more astonishing 19%! And we are talking of growth in constant prices (i.e. no impact of inflation). When we talk of growth in constant terms, it implies the growth is driven by either higher volumes or better mix (i.e. higher growth in higher value products). But take a look at UP’s crop production in FY 21–22 — production for both foodgrains (rice, wheat etc) and non-foodgrains (sugarcane, cotton, oilseeds etc) declined versus 2020-21! Given this growth rate for production, a 19% growth in agricultural crops sub-sector makes absolutely no sense.
So we move on to the next section with the caveat that the agriculture growth figures for 2021-22 are almost certainly overstated. That has implications for the annual GDP growth performance that we discussed earlier — i.e. even the very modest annual outperformance of 20 bps might actually be non-existent.
Section III: GDP internals paint a mixed picture — industry shows promise, agri not much
I analyze the GDP internals in this post but start by reminding the readers about the caveat that there is something seriously whacky about the FY 21–22 agriculture growth numbers and the FY 16–17 industry sector baseline figures. I had adjusted down the industry numbers for FY 16–17, I can perhaps do the same for the FY 21–22 agriculture numbers as well but I do not want to overengineer the base case analysis.
GDP internals — a late surge in Agri and industrials drive Yogi outperformance, but numbers are dodgy
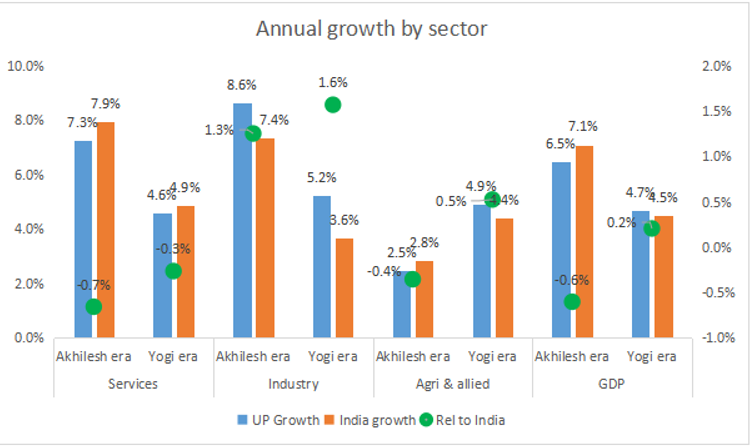
I remind readers of the table in Section I which shows Yogi delivering a modest relative outperformance compared to Akhilesh in terms of GDP growth. The chart below looks at the CAGR by economic sectors for Akhilesh era (FY 12–13 to FY 16–17) and Yogi era (FY 17–18 to FY 22–23). On the face of it, Yogi has outperformed Akhilesh in all three sectors (relative to overall India growth) albeit quite modestly. But, of course, the agriculture growth figures of 15% for FY 21–22 are meaningless — if one assumes a pretty robust 5% growth for FY 21–22 and FY 22–23 instead, the annual pace of growth during Yogi’s period drops to 3.5%, which would be a 90 bps underperformance vs national average. Also, the outperformance in Industry sector (1.6% vs 1.3% for Akhilesh) is attributable to a dramatic 15% growth in FY 22–23, compared to national average of just 2.4%. Such a humongous outperformance calls for further enquiry but still, it would be fair to assume the sector is seeing a resurgence in the last two years.
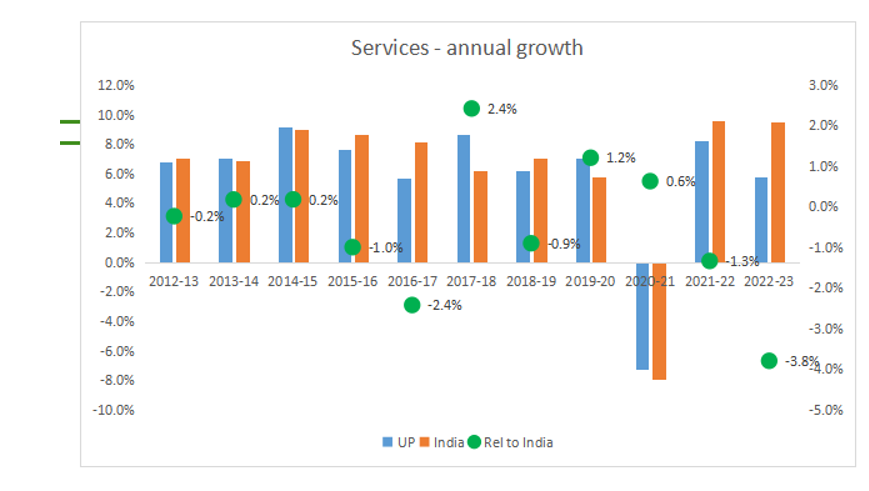
Two things stand out in the chart — one, a look at both periods show a reasonable level of momentum in industry sector (though there is lot of volatility in annual numbers) if one takes the full period into consideration. Yes, outperformance has been better under Yogi but Akhilesh has done quite well too (of course, the FY 16–17 figures are suspect). Also, Yogi’s outperformance has been driven by very strong growth in the most recent year, the initial years were quite weak (more on that later). Two, services are a drag on relative performance under both Akhilesh and Yogi and that is important because the sector constitutes more than half of the economy.
Weaker GDP growth in initial years due to industry and agriculture, services relatively steady
As the GDP growth table in the earlier section showed, the first 3 years of Yogi saw weak growth, trailing the national average. Below, we look at annual growth rates by sector and it shows the the weakness was driven by industry and agriculture sectors, while services, held relatively well.
Industry — initial years weak but a sharp surge in FY 22–23
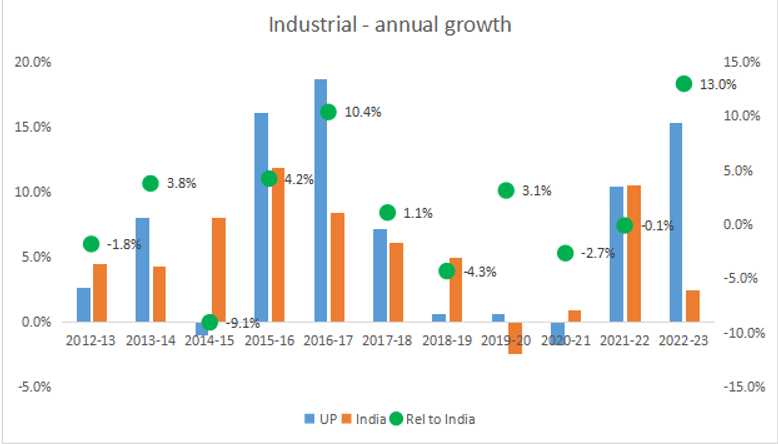
Given the uncertainty over the FY 16–17 baseline, any commentary on growth numbers for individual years is futile but it is clear that the growth trend for the first four years was quite weak. This can be partly explained by UP being disproportionately impacted by demonitisation and GST but we will see if it also has to do with fiscal policy (discussed later). The catch up with national average happens only in the fifth year and then we have an astounding 15% growth in FY 22–23 vs national average of 2.4%. Make of that what you will. But if we take the first term of Yogi, the annual growth rate would be only 3.3%, underperforming India by 60 bps.
Services drag, possibly due to relative stage of development
The underperformance in services sector relative to India is explained, in part, by the much faster growth in financial services & real estate sub-sector in rest of the country vs UP which in turn can be attributed to the relatively advanced stage of development of the former.
Overall, services sector growth has been relatively stable (except for the pandemic year) and I do not have any specific insight to offer though I would note a couple of things: the 7.3% growth during Akhilesh’s period was driven by exceptionally strong mid-teen growth in two sub-sectors — communication (growth of IT services in NCR region?) and road transport. During Yogi’s period, construction growth has been quite robust in the last two years.
Agriculture — weak production trends at odds with sector growth data
As the chart below shows, annual growth in Agriculture & allied sectors during the first four years of Yogi rule was quite weak, meaningfully underperforming the national average. And then we had the unreal 15% growth surge in FY 21–22 which I had discussed in Section II. So while optically, the annual growth during the Yogi era is a very healthy 4.9% (vs 4.4% for India), the production trends of agricultural crops is at odds with that figure — agricultural crops account for two-thirds of the sector and officially grew at the same pace as overall sector. As seen in the table below, the production growth of both foodgrains and non-foodgrains in UP trailed the national growth rate during the first six years of Yogi’s rule while vegetable production was modestly above national average. The underperformance of the state also largely maps with the possible underinvestment in agriculture given expansion in gross irrigated area was below the national average as well.
Conclusion – promising signs from industry sector, agriculture weak
A deeper look at the GDP internals leads to somewhat greater skepticism of even the modest growth outperformance seen during the Yogi period. That said, the strong growth figures for industrial sector during FY 22–23 — even if one does not believe the 15% figure — is a promising sign of a resurgence. But there is nothing much in the services or agriculture growth figures which inspire any promise, except perhaps the decent growth in construction in last couple of years. Next up, I explore Yogi’s fiscal record and how it has impacted growth.
Section IV: step-change in capex? yea, but in the wrong direction
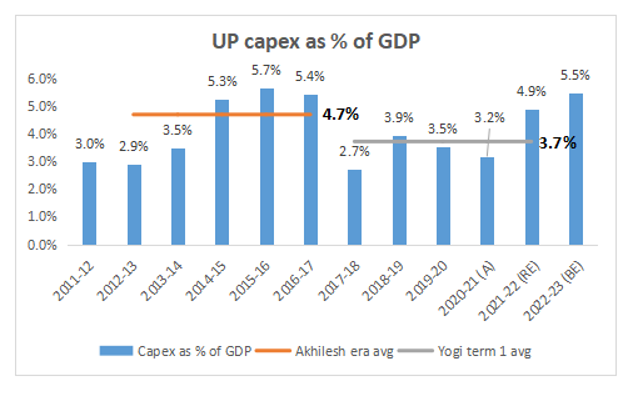
This part is perhaps the most straightforward in an exercise made quite complicated due to messy economic data. A claim made by Yogi supporters is that the weakness seen during the initial years of his rule is due to A) fiscal consolidation and B) shift away from revenue to capex spend which delivers benefits with a lag. I will address the former in the next section. In this section I show that not only did capex spend not increase sharply during Yogi’s first term, it actually fell quite sharply from the average levels seen during Akhilesh’s rule. In fact, the weak capex has arguably been a key driver of weak growth in Yogi’s first term.
The chart below shows the state government capex as a % of GDP. As you can see, capex dropped by exactly half y/y during Yogi’s first year! It picked up modestly in year 2 but again fell for the next two years. Only in the last year of the first term did capex finally pick up and cross the average of Akhilesh era. Overall, average capex during Yogi’s first term was a full 100 bps below that of Akhilesh era. I am focussing on the first term because that is the period of economic underperformance.
Now, let me address a few counterarguments to the above analysis:
- A) The capex figures in the last two years of Akhilesh’s period look fishy given the sharp spike. Fair. But even if one takes the year-2 capex of 3.5%, Yogi’s first term is just largely in-line
B)What about other states? Was this a period of overall slowing down on capex spend? Turns out, it is not. The average for Indian states was flat for both periods.
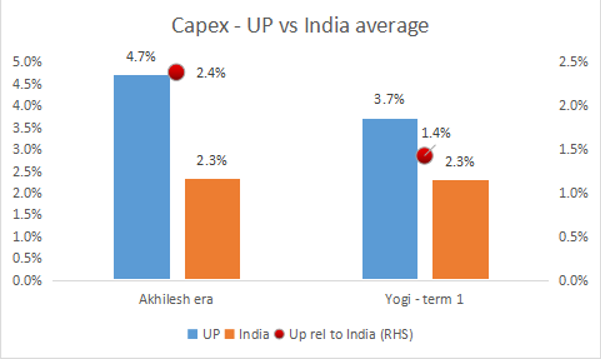
- C) What about the pandemic? That would have really hampered execution of capex spend for all states? Well, again, the answer is no. The combined capex spend for the states stayed flat during the pandemic year.

Conclusion – data belie the narrative of Yogi government’s infrastructure focus
Official numbers show a major step-down in capex in the first term. Even if one is skeptical about Akhilesh’s year 4 & 5 figures, one can say for certain that there was no step-up change in capex spend during Yogi’s first term. Arguably, the sharply lower spend was a major reason for the economic slowdown seen in the first three years. Yes, we are seeing promising signs in 2022–23 numbers and the budget for 2023–24. Supporters of Yogi would argue that during the first term, Yogi government was focussed on setting up the process for a more efficient execution program (read: lower corruption) but that is beyond the scope of this analysis. I will leave that to the readers to judge for themselves.
Section V: Did Yogi’s the fiscal policy misfire?
Yogi supporters assert that Akhilesh ran a fiscally loose government and one reason for the growth deceleration in the initial years is because Yogi had to clean up the state finances. It is true that the first three years of Yogi rule saw a rather dramatic tightening of the fisc and was likely a key driver of the economic slowdown. But an analysis of the state’s fiscal position does not indicate an urgent need for a massive fiscal tightening — in fact, it very likely was counterproductive because it was pro-cyclical and served to further exacerbate the economic pain due to demonitisation and GST. Yogi government appears to have realised it by 2020 and went in for a course correction starting from the pandemic year. It is not fully clear why Yogi went in for a major fiscal shock early in his tenure; one can only speculate that BJP has many advisors/experts in its ranks who have a fiscal fetish.
A massive, misguided (?) fiscal tightening in first 3 years, then a course correction
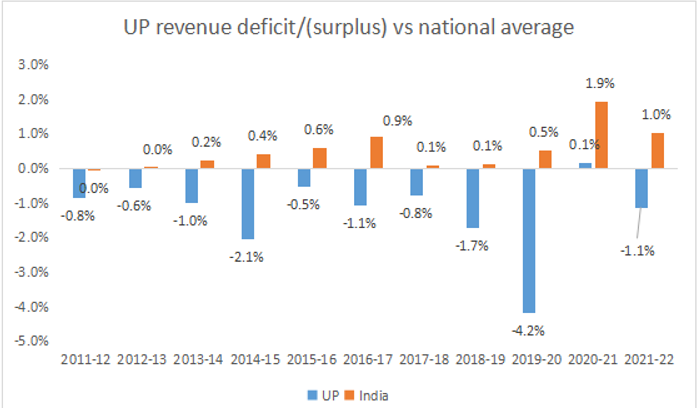
The fiscal deficit for UP in 2016–17, the last year of Akhilesh’s rule was 4.3%. This was relatively high compared to weighted average of all states of 3.5% but it was not a major outlier. There were 10 other major states which had a fiscal deficit of 4% or higher. Further, of note, UP’s was actually running a revenue surplus budget in 2016–17 — as noted in the previous section, UP was running a massive capex program (5.4% of GSDP) in Akhilesh’s last year.
Note: Fiscal deficit = total revenues less all expenditure, revenue deficit/surplus = total revenues less non-capex expenditure
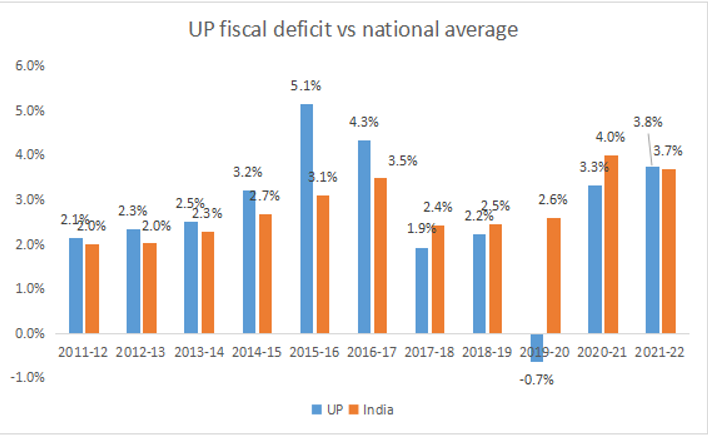
What followed over the next 3 years is extremely intriguing. The Yogi government sharply reduced its spend — both revenue and capex (which we discussed in the previous section) — bringing the state to a fiscal surplus 0.7% by 2020–21. This is a nearly a 5.0% contraction in government spend (as % of GDP) in 3 years at a time when the economy was already facing major headwinds. And it would be reasonable to attribute the economic slowdown over the first 3 years to the fiscal shock. As the chart below shows, the average fiscal tightening by other states during the period was much more modest (and sensible) — from 3.5% to 2.6%.
The government then went in for a major course correction in 2020–21 and by 2021–22, fiscal deficit was back to 3.8%. So at the end of its first term, Yogi only had a very modest fiscal consolidation of 50 bps over a 5 year period to show for all his efforts. In terms of revenue surplus, the state was right back at the levels at which Akhilesh had handed over to Yogi (i.e +1.1%). This performance is in-line with the national average.
Other states handled a loose fisc position much better
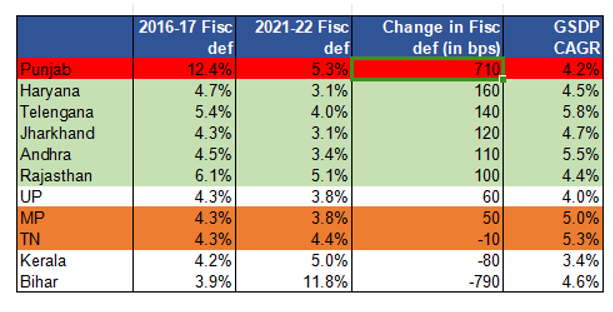
As mentioned earlier, there were 10 other major states with a fiscal deficit of ~4% or higher in 2016–17 and a majority of them were able to deliver superior economic outcomes over the next five years. I am ignoring 2022–23 because the RBI numbers are based on Budget Estimates (BE) and in many cases, these estimates tend to be wildly optimistic.
As the table below shows, 5 states delivered both a higher GDP growth and better fiscal consolidation than UP (highlighted in green, Punjab has been ignored because its 2016–17 fiscal deficit is an outlier). Another two states have delivered better GDP growth while underperforming UP in fiscal consolidation. MP’s case is especially noteworthy because its economy is comparable to UP (similar per capita income, agri weighted) — it has delivered an additional 100 bps of annual growth while delivering similar levels of fiscal tightening.
Conclusion —misguided fiscal policy likely damaged UP’s growth
Unless there are non-economic or regulatory reasons which pushed Yogi for the sharp fiscal tightening in his initial years, it appeared to be an unforced policy error which has likely driven the economic underperformance in the initial three years. One argument that has been put forth is that Yogi was focussed on tightening up the administration and reducing leakage/corruption. But it is not a very convincing reason for delivering such a major fiscal shock during a time of economic slowdown.
Section VI:- give Yogi more time, but desist from premature triumphalism
Yogi’s administrative record overall has arguably been good, especially his tough approach to Law & Order, in a traditionally lawless state. Welfare programs appear to have been executed well with relatively low leakage, seen as a key reason for his re-election last year. The Yogi government has also focussed on raising its fiscal resources and has been one of the best performing states in terms of growing its tax revenues (alochol taxation being a key contributor). But these are relatively low-hanging fruits. Turning around a poor economy like UP and putting it on the path to growth is a much more arduous task.If UP were a separate country, it would be the fifth or sixth largest in the world – the state’s economic development is not a single-term project, it is a multi-decade one. It is not overdetermined that a strong, charismatic leader can even deliver it. It requires strong policy nous, a team of efficient political leadership and a bureaucracy which is capable of executing on it. I posit that desisting from premature triumphalism and focus instead on a more critical examination of Yogi’s administration would serve the cause well.
All data sourced from RBI HANDBOOK OF STATISTICS ON INDIAN STATES
Basically Go with anecdotes to make a decision about an economy. Statistics are only to serve as Propaganda.