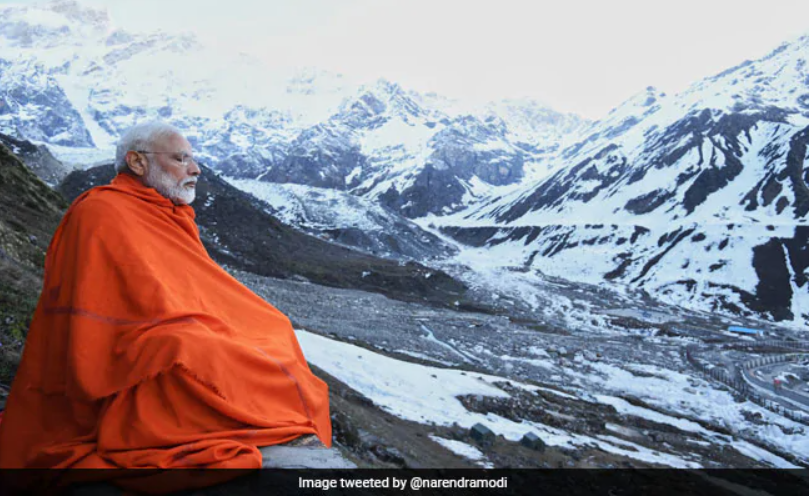
The following post is contributed by @saiarav from X or Yajnavalkya from Medium
Modi does the unthinkable – goes to polls with a non-populist (revdi-free) budget
At the start of this year, I had written about Modi’s excellent economic stewardship during his second term amidst a period of extreme economic turbulence globally – a once-in-a-century pandemic followed by a major war which roiled energy markets and rapid rate hikes in the West to combat inflation (Modi’s fiscal masterclass). I had noted then that Modi:
“has achieved the near impossible of following a disciplined fiscal policy while not just maintaining his political capital, actually expanding it”
But I had fully expected that he would open up the purse strings during the election year budget this February notwithstanding his public remonstrations against the growing revdi (freebies) culture. And for good reasons. One, Modi had gone in for a ‘revdi’ at the end of his first term in 2019 (the cash transfer scheme for 120 million farmers). And the economic scenario in 2024 was decidedly more mixed compared to 2019 with greater level of economic distress among the poor. Two, recent state elections had seen parties winning based on extremely aggressive freebie promises. For example, Congress won handsomely in Karnataka last year with promises of a slew of freebies (or welfare programs if you like) amounting to more than 2% of the state’s GDP. So I must not have been the only person who was stunned to see that Modi had decided that the normal rules of politics does not apply to him. And as of today, his judgment appears to be spot-on because the only debate about the 2024 elections appears to be what his margin of victory will be. The reasons for this – the so-called “akshat-wave” after the Ram mandir inauguration, the opposition being in absolute shambles, the ever-increasing political stature of Modi – calls for a separate discussion. In this post, I peer into the future and see what Modi’s fiscal statesmanship could potentially mean for the country.
A 10-year long fiscal tapasya….
For reasons that are not entirely clear, fiscal conservatism has been an article of faith for Modi throughout his career as an administrator. He has held on to it steadfastly during his entire 10 years as the the Prime Minister. For anyone familiar with Indian politics, it is easy to appreciate how challenging it can be to stick to fiscal discipline even during times of buoyant revenues. This makes his unrelenting fiscal focus all the more remarkable considering that for most of his tenure, he has been hemmed in by weak tax revenues. Therefore, to call Modi’s 10 year long commitment to financial discipline as a tapasya (penance) would not be out of place.
…might finally yield a Rs.20T (~$50bn) -sized fruit during Modi-3
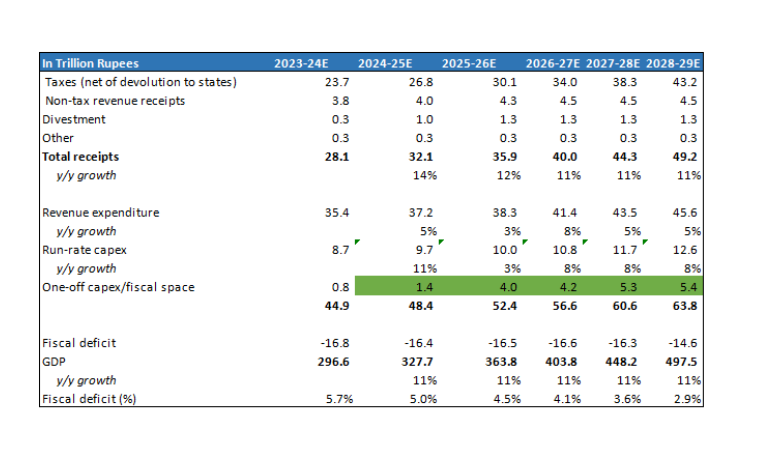
And Modi is on the cusp of reaping the fruits of that tapasya in his third term. Barring unexpected shocks – electoral and economic – he could be presiding over a period where the economy has sizeable fiscal resources to pursue its socio-economic goals; a rare event in independent India’s economic history. Underpinned by a solid cyclical recovery in the economy and strong buoyancy in tax collections (direct taxes likely grew at 20% in 2023-24, twice the pace of nominal GDP growth), Modi-3 is not only placed very comfortably to meets its 2025-26 fiscal deficit target of 4.5% (vs. 5.8% in 2023-24), it will also have its disposal, up to Rs.4 trillion of fiscal space during 2025-26 for spending on new programs or projects (or >1% of GDP) after meeting its regular revenue and capital expenditure obligations. That is the base case which assumes direct taxes grow at 15% annually. In a bull case of direct taxes continuing to grow at 20%, the above figure could be as high as Rs. 5.5 trillion. Further, this figure will continue to swell with each succeeding year as the economy expands and revenue growth outpaces the growth in base expenditure. During Modi’s third term, I estimate that the central government will have up to Rs.20 trillion of aggregate fiscal space for new programs/projects. Also, note that many of the programs of the central government include contribution from the states, which means the total fiscal resources available could be well higher than Rs. 20 trillion.
(For those interested in the math behind the above numbers, I discuss the same at the end of the post) .
Potentially transformative, but availability of funds is not enough
What can one do with an annual budget of Rs.4 trillion? Well, for perspective, the Jal Jeevan Mission which was initiated in Modi’s second term with an annual budget outlay of Rs.0.7T (Rs.3.5T over 5 years, 60% funded by centre) will have provided tap water connections to 160 million households by end of 2024 (110 million connections provided as of April 2024). No commentary required on how transformative this project has been for the 100s of millions of beneficiaries.
In the first two terms, Modi’s focus was primarily on building physical infrastcucture – road building under Gadkari has been an unqualified success while in case of Railways, huge investments have been made, it is still a work-in-progress with mixed results so far. Even welfare schemes had a physical asset bias – from toilets to piped water to housing. While the government deserves a lot of credit for strong execution, it has to be underlined that these are relatively low-hanging fruits from a governance perspective. As the priority areas inevitably shift from road and railways to more complex ones, quality of policymaking, human capital and management will be the key drivers of outcomes, and not just availability of funds. To wit, it is way more difficult to develop 20 high quality IITs or a few hundred Kendriya Vidyalayas compared to building 100K kms of roads. Or just throwing around money into PLIs will not deliver a successful industrial policy.
An opportunity for Modi to cement his legacy – a wide range of focus areas to choose from
What areas Modi will prioritize with the Rs.4 trillion per year (~$50bn) of additional resources is anyone’s guess because this is one government which revels in keeping its plans a total secret. One can only say two things with certainty -one, Modi will be extremely keen to cement his legacy with a couple of flagship projects/programs which has a transformational impact on society. Two, the consummate politician that he is, he will have his eyes firmly on what programs will drive the optimal political benefit for the 2029 elections (and all the state elections over the next few years).
The list of potential programs is endless. Below, I discuss briefly a few ones which I see as critical ones. I classify them into 3 categories: A) long term strategic B) medium term economic growth and C) quality of life. Obviously, most of these programs will tick all three boxes, the classification is based on how a politician like Modi would want to see it. Admittedly, some of the resources might also simply get used up in standard fiscal management as well – ie Modi might simply want to reduce fiscal deficit at a faster pace, or execute the long pending reduction on tax surcharges on the rich or fill up the job vacancies in the government.
- Long-term strategic
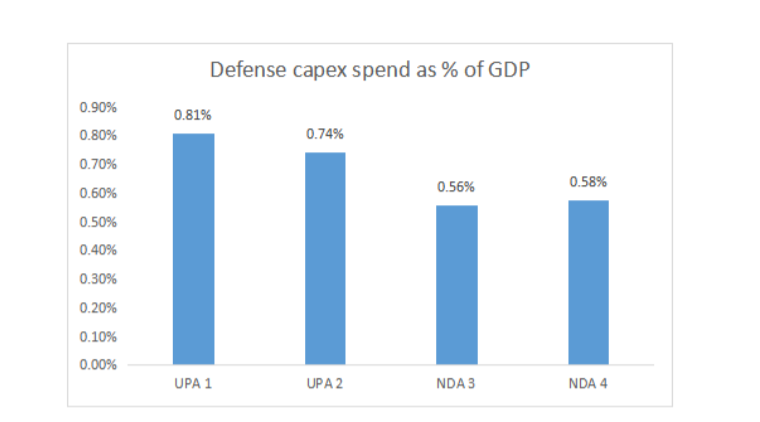
- Increase defense capex spend – In contrast to his public image as a hawk on national security, the the spend on defense capex has been rather modest. In fact, as a % of GDP, it has dropped from the levels seen during UPA. With the China threat escalating in recent years, Modi would want to increase defense capex by at least 10 bps (100 bps = 1%), if not 20 bps and get back to UPA levels. That would be 0.35-0.70 trillion increase in annual outlay.
- Increased R&D spend – India’s R&D spend is abysmally low at around 0.6% of GDP compared to 2.4% for China. The spend has seen a steady decline from the 2008 peak of 0.9% and private sector has shown very little inclination to spend on R&D with their contribution being only around one-third of the total spend whereas in countries like China and Korea, the figure is more than two-thirds. A key policy objective for the government, apart from increasing its own direct spend, should therefore be to bring in major policy incentives to crowd-in private investments in this area. As it happens, the government has already signaled that this will be a priority area in the third term, announcing a Rs.1 trillion fund to provide long-term interest free loans for R&D work. But much more needs to be done.
- Energy security – There are two parts to this. One, as a major importer of oil & gas with demand continuing to grow for the forseeable future, the country needs to own equity in oilfields and LNG plants abroad to enhance its energy security. For example, if India wants to secure say ~20% of the nearly 5 million barrels/d of crude it will import this year, that will mean an investment of $40 billion. Of course, the investment will be done via the government owned oil companies and it will be partly funded via debt. But it might still entail the government infusing a $5-$10 billion of equity.
The second part is investment in energy transition. So far, the Modi government has bet big on solar but now it has also stated its intention of expanding its nuclear fleet (add 15 GW by 2030). While investments in solar power has been largely driven by private players, the government will need to play a big role in setting up nuclear plants. A back-of-envelope estimate for the cost of the plants would be $50 billion and it would be reasonable to assume that the government will have to invest close to half of that amount.
- Medium-term economic growth
- A PLI-powered industrial policy – An easy prediction to make is that a turbo-charged PLI program will be the topmost priority for Modi-3. After all, the biggest failure of Modi- 1& 2 has been the inability to kickstart growth of the industrial sector and deliver well-paying manufacturing jobs to to a burgeoning labor force. Success or failure to deliver on this during the third term will likely be the most consequential factor in 2029. With the success of the modest sized PLI programs so far, Modi will look to bet much bigger sums on the program. But, at the risk of repetition, PLI itself will not be sufficient. A lot more work needs to be done in terms of improving ease of Doing Business, bringing down land costs, labor laws, building a skilled workforce and so on. One specific area where I really hope Modi-3 focusses on is building a vibrant EV industry (nah, not the two-wheelers, cars are the real deal). We are already a few years behind almost every major auto market globally on EVs. If China is the undisputed leader in EVs today, it is because the government has pumped in nearly $200bn into the industry via subsidies, grants and incentives over the last two decades.
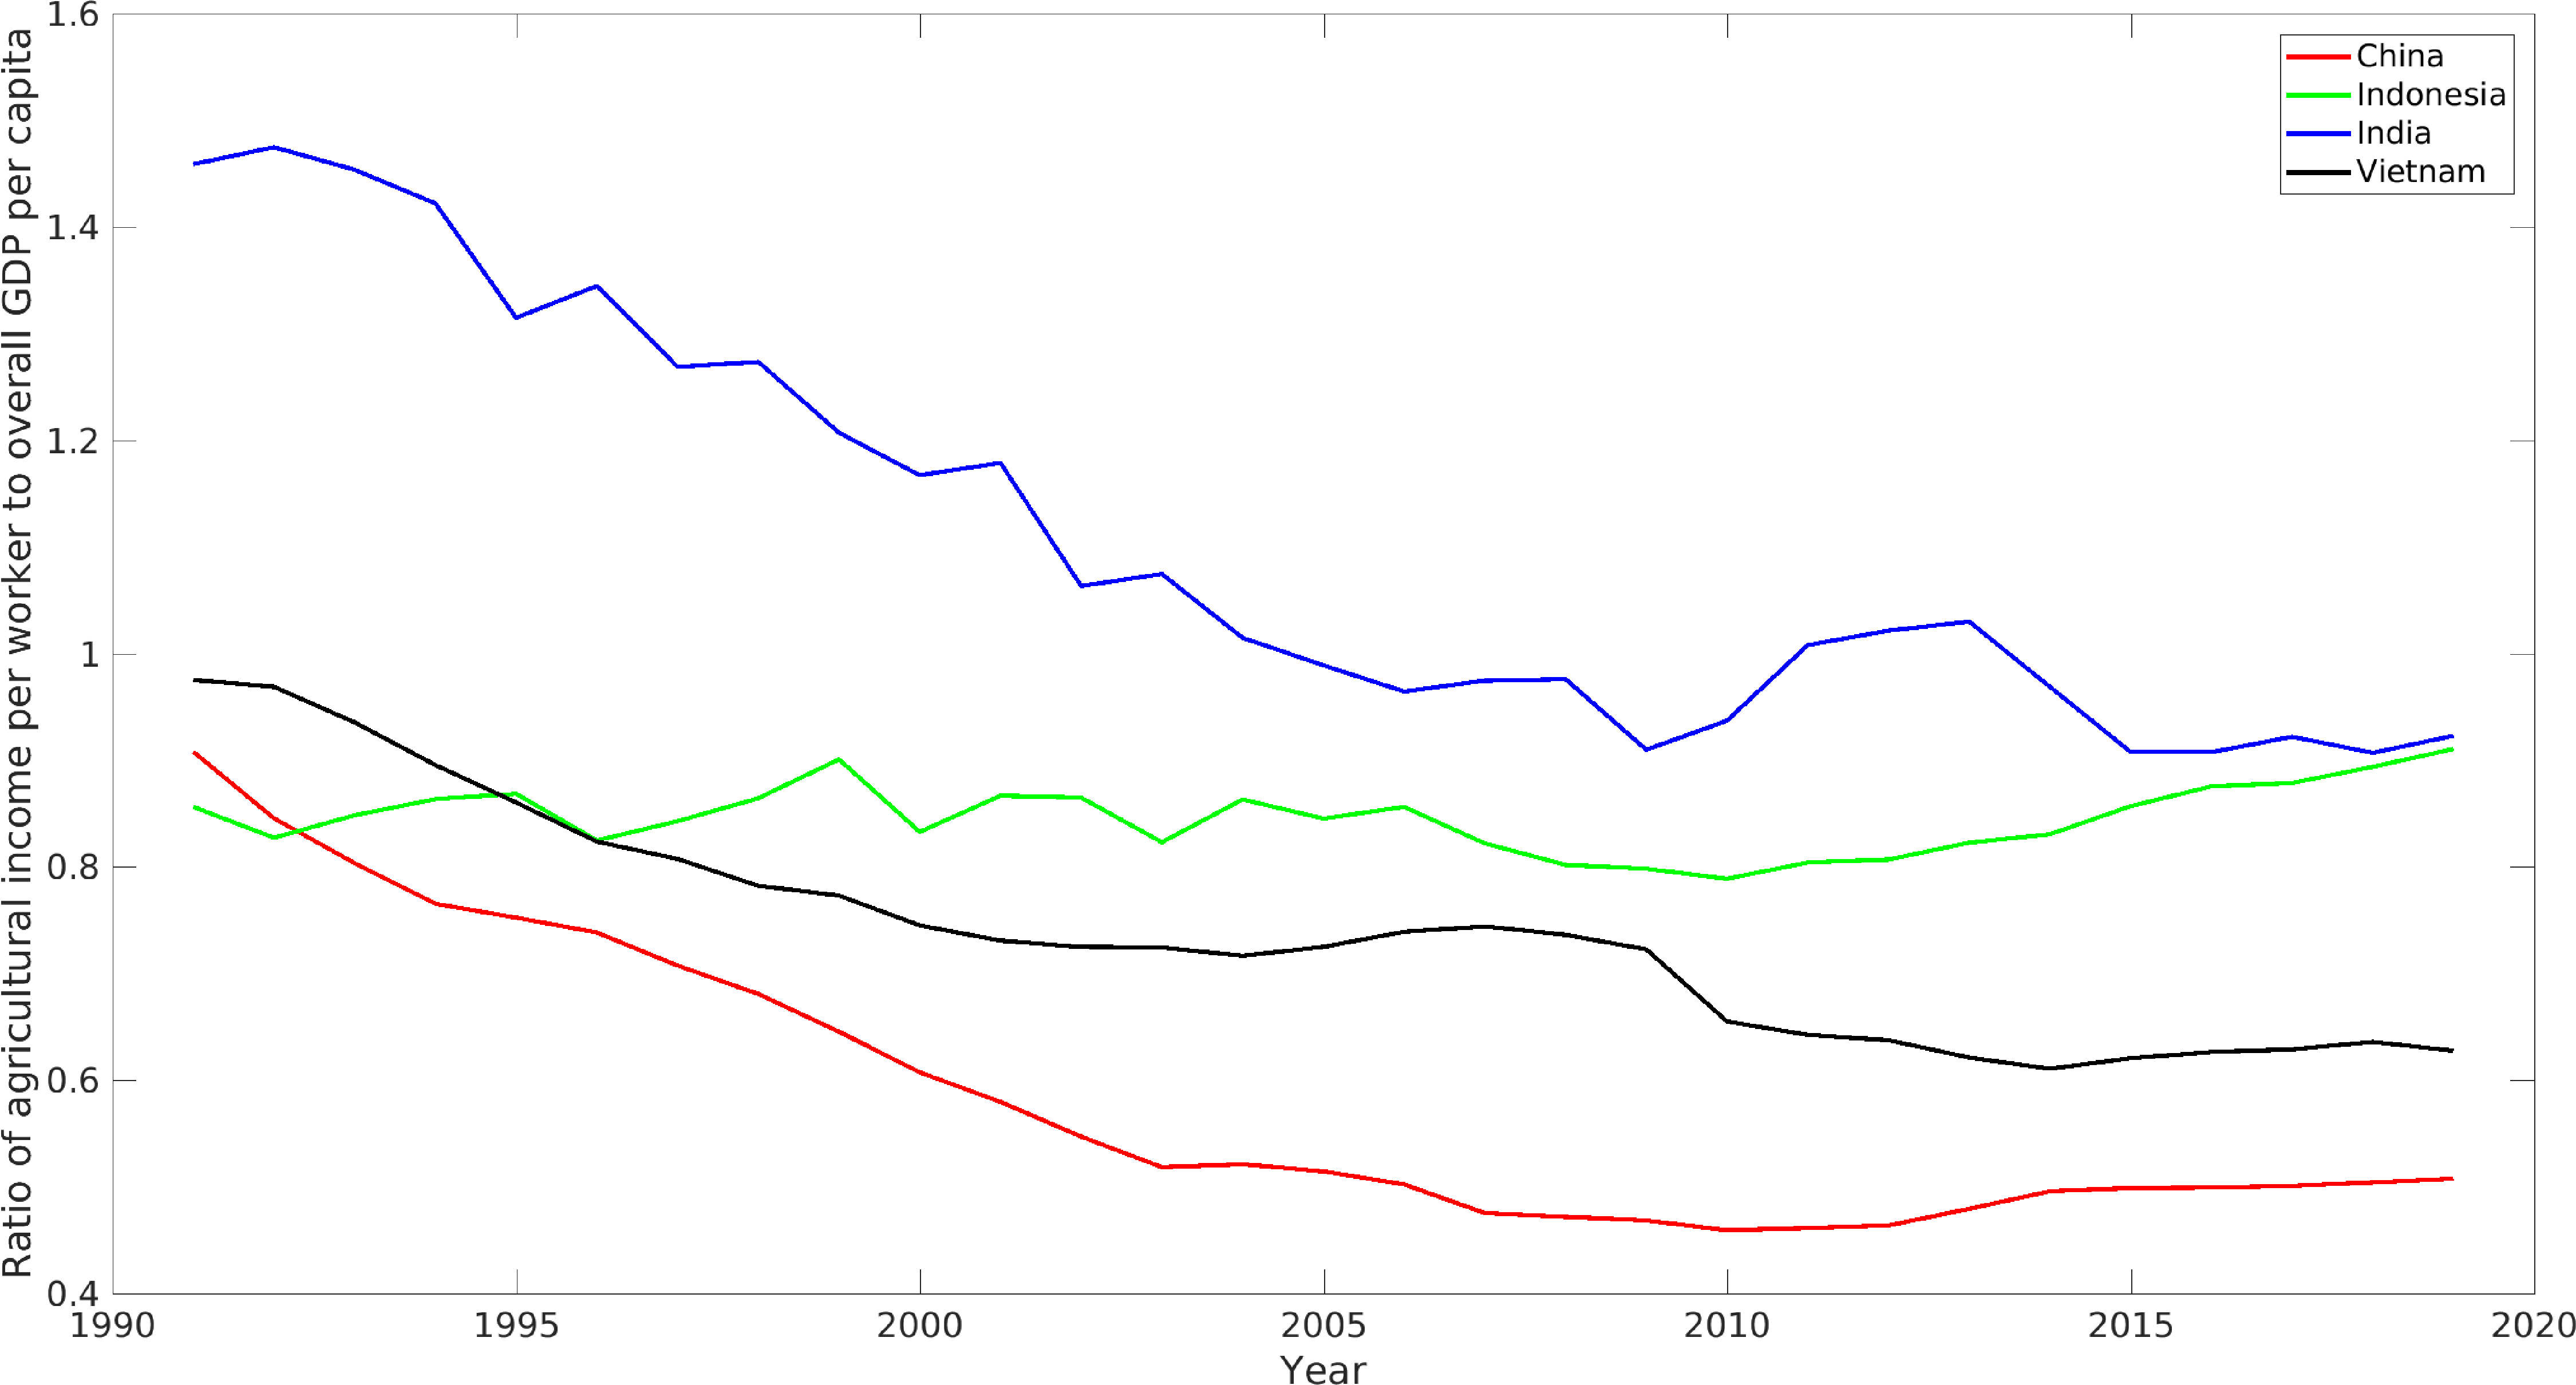
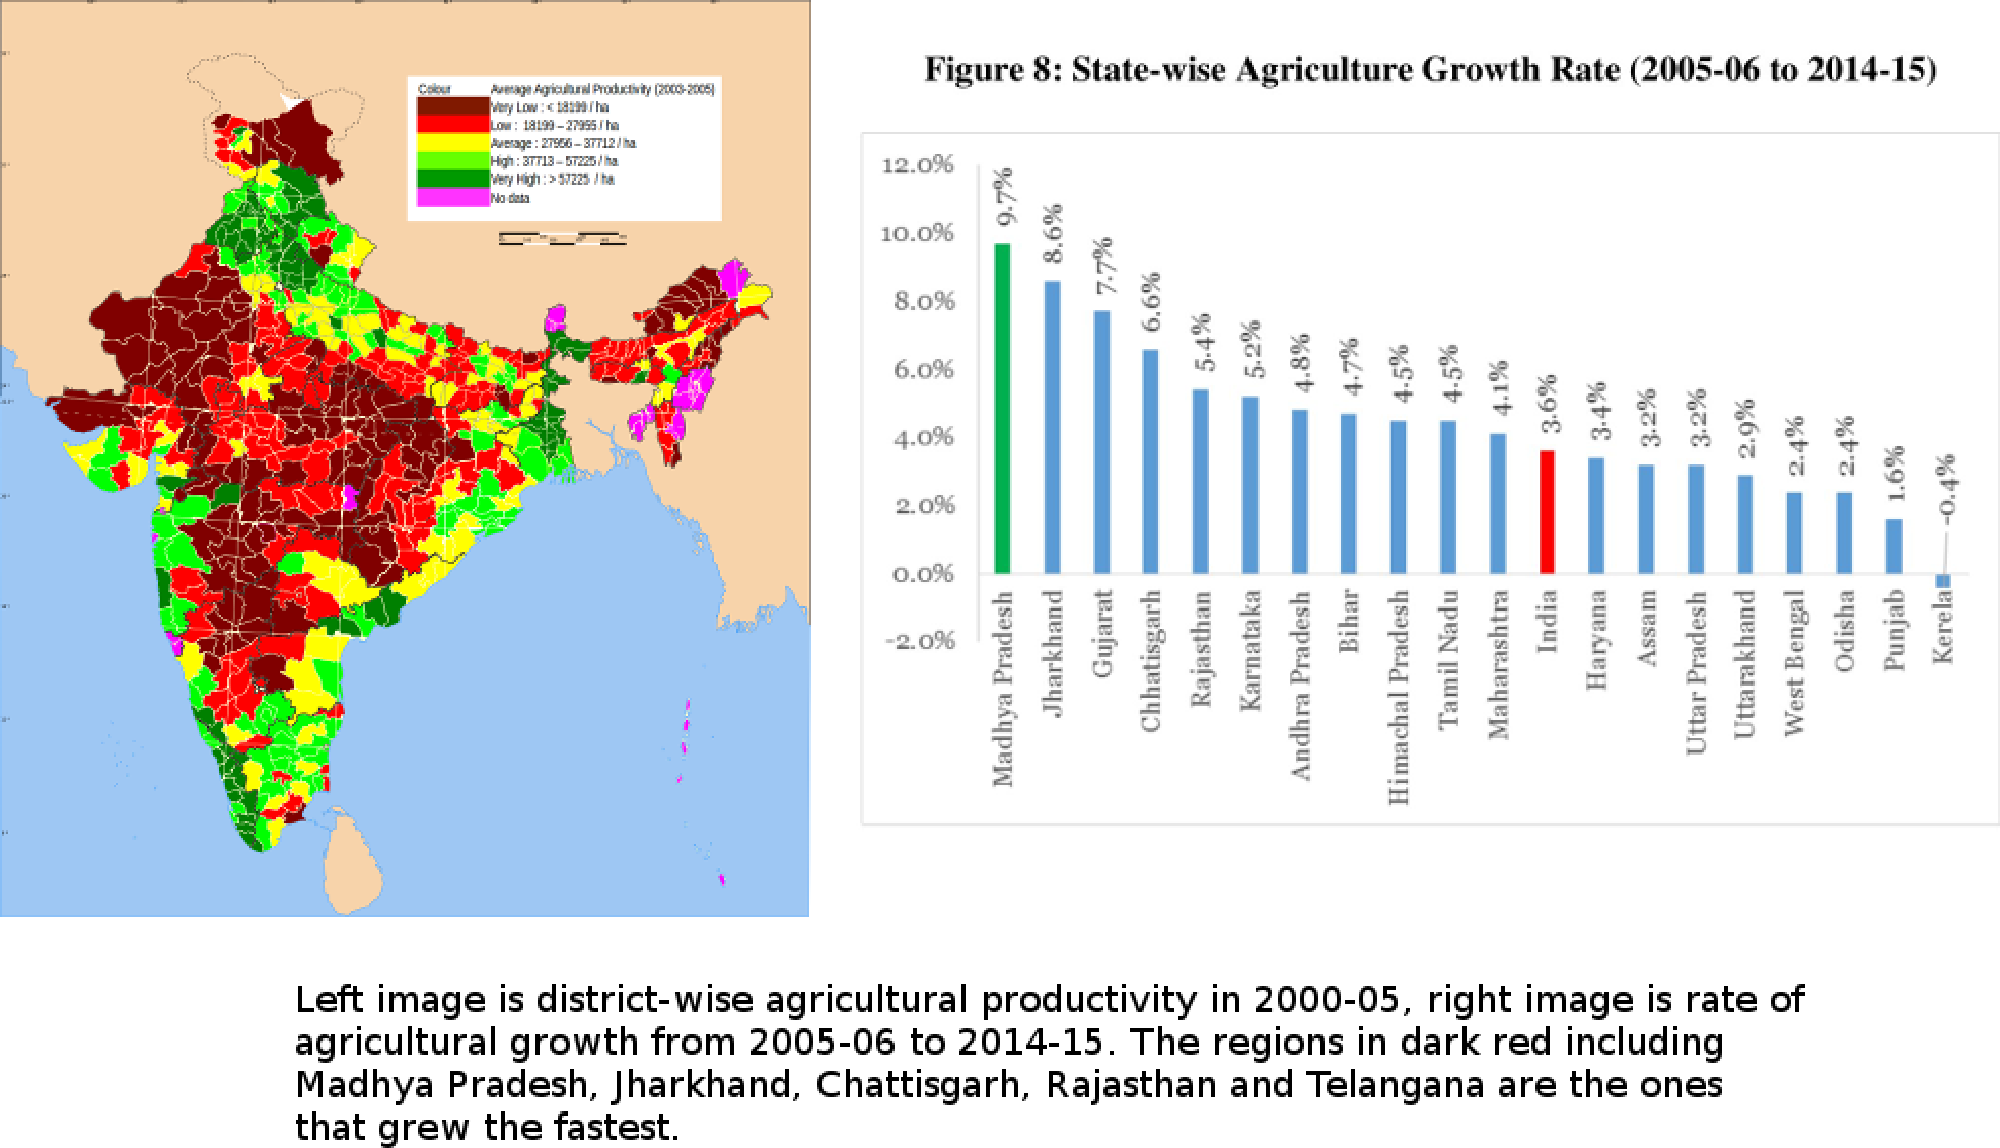
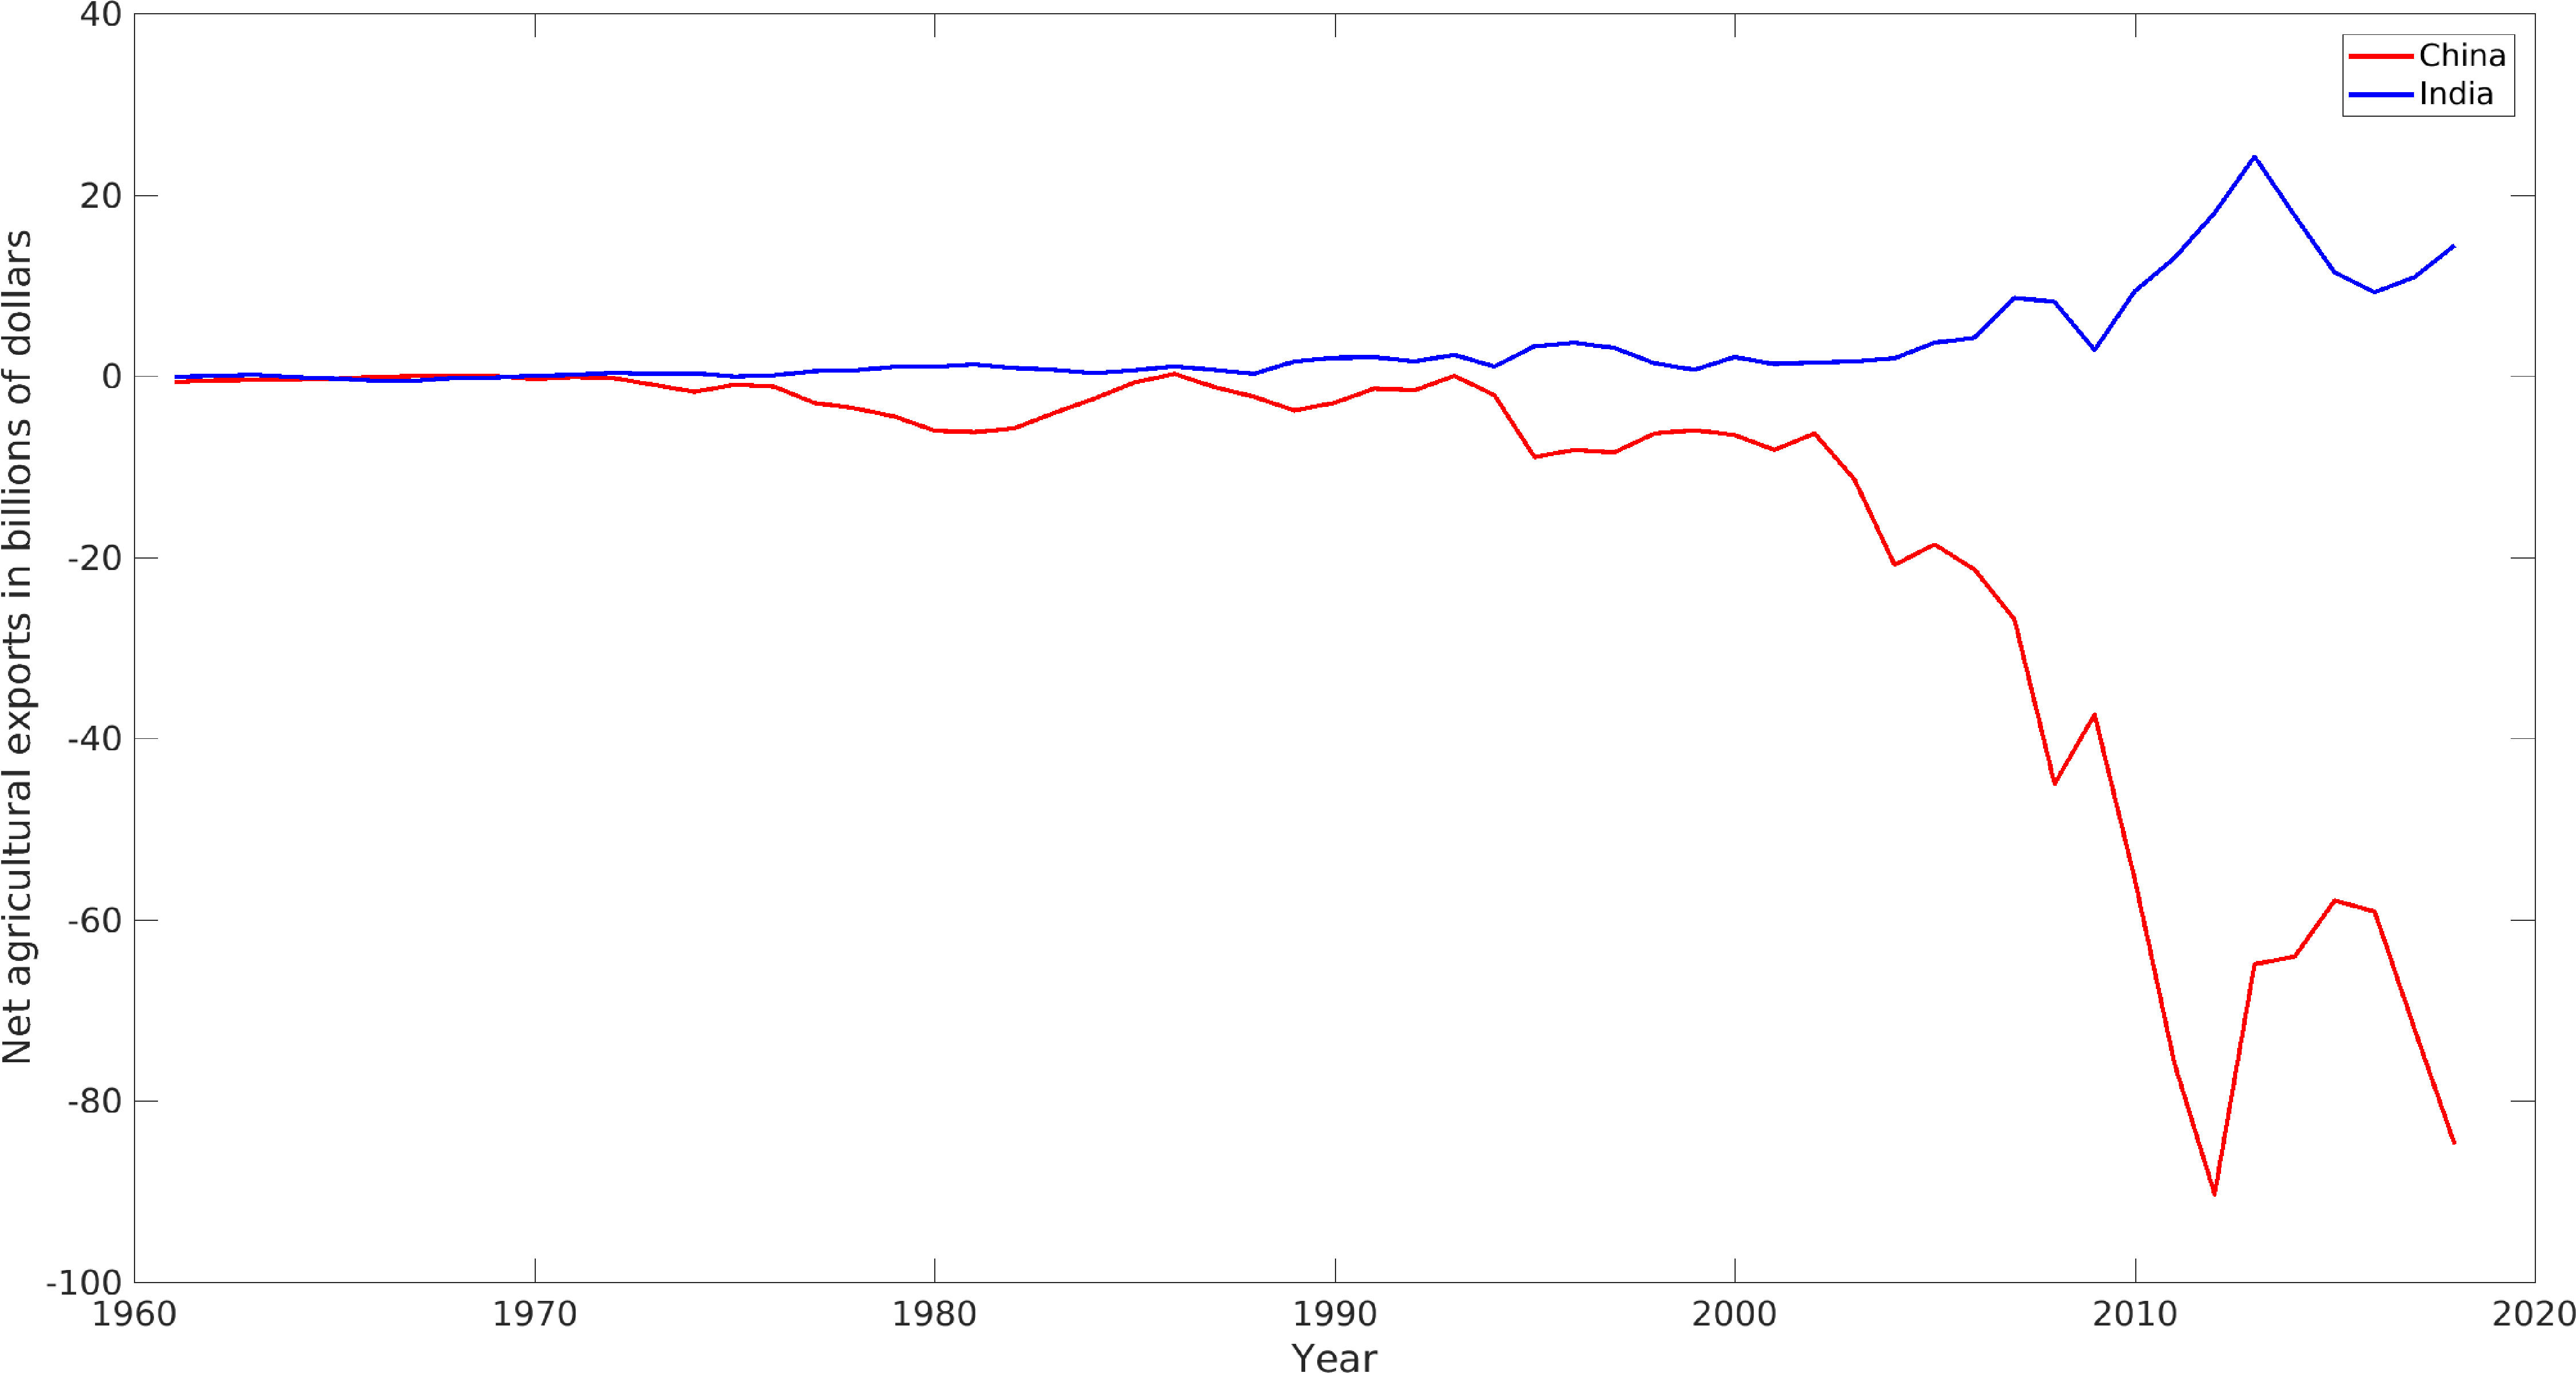
- Agriculture – The government would be keen on doing something transformative in this sector, not least because it is still the largest vote bank, but I am not sure ploughing in large sums of money will solve the structural issues bedeviling the sector. Having got their fingers burnt during the second term with the farm laws, it is unclear to me what major policy action they could take up for this sector.
- Quality of life
- Urban housing and infrastructure – Another easy prediction to make is this (especially urban housing) will be one of the biggest focus areas in the third term given Modi’s penchant for physical infratsrructure. The political dividends will be way higher than what he has received for roads since the change will not just be very visible to the average voter, it will also have deeply positive impact on his day-to-day life. Modi has already delivered well on rural housing but urban housing will be way more challenging, not least due to scarcity of land and a large, ever-increasing migrant population. It will require well-thought out policies and mich greater co-ordiation with the state and local governments
- Health and education – The public investment in health and education has been woefully short forever and that trend has continued thru the Modi years. Between the two, I think Modi will focus on health because the political benefits accrue faster and it is also relatively less difficult to execute compared to education. On paper, both these sectors can easily absorb, individually, an additional 0.5% of GDP (I.e. almost the entire Rs.4 trillion fiscal space) given the historical underspend in the sectors. But, more than any other programs, funding is a much lesser factor compared to the ability to build quality organisations which can deliver.
The fiscal math
Assumptions
- Nominal GDP grows at 11% (6.5% real and 4.5% inflation)
- Direct taxes grow at 15% annually while GST grows at 13%
- Divestment (both PSU equity and physical assets) per year of Rs1.25 trillion
Fiscal deficit falls to 4.5% by 2025-26 and below 3% by 2028-29.
A few points:
- 2024-25E total capex was Rs. 11.1T but this included equity infusions to BSNL and funds for the Science Fund which will not be repeated.
- The Jal Jeevan Mission wich has an outlay of Rs 0.7T in 2024-25 comes to and end during the fiscal year, hence lower growth in revenue expenditure in the next year. That, in turn, adds to the fiscal space.
- Run-rate capex is for ongoing projects across various sectors – more than half of it is for Roads and Railways. The assumption is that the allocation to the two sectors have peaked and will see more a modest 8% growth growth forward.
- Higher growth baked into 2026-27 revenue expenditure to factor in 8th Pay Commission.
 In my view a level 5 PISA score is the minimum requirement for a person to be considered a high school graduate who is literate in math, able to function in the modern global economy, or be qualified to attend college. The PISA report defines a level 5 PISA score or better as a fifteen year old that “can model complex situations mathematically, and can select, compare and evaluate appropriate problem-solving strategies for dealing with them.”